Apple Vision Pro User Guide
- Welcome
-
- Change notification settings and device sounds
- Set the date, time, language and region
- Change your device name
- Change the appearance of text and windows
- Unlock your iPhone with Apple Vision Pro
- See your keyboard, gaming controller or iPhone while immersed
- See people around you while immersed
- Use Apple Vision Pro in Travel Mode
- Refresh apps in the background
- Set content restrictions in Screen Time
- Let others use your Apple Vision Pro
-
- Get started with Apple Intelligence
- Use Writing Tools
- Create original images with Image Playground
- Create Genmoji
- Use Image Wand
- Get web page summaries
- Summarise an audio recording
- Summarise notifications and reduce interruptions
- Use ChatGPT with Apple Intelligence
- Apple Intelligence and privacy
- Block access to Apple Intelligence features
-
- Apple Music Classical
- Books
- Calendar
- Capture
- Clock
- Encounter Dinosaurs
- Home
- Maps
- Mindfulness
- News
- Numbers
- Pages
- Podcasts
- Reminders
- Shazam
- Shortcuts
- Spatial Gallery
- Stocks
- Tips
- Voice Memos
-
- Get started with accessibility features
- Turn on features with the Accessibility Shortcut
- Change Siri accessibility features
- Use Guided Access
- Copyright and trademarks
Add or modify a graph in Keynote on Apple Vision Pro
When you create a graph in Keynote on Apple Vision Pro, you type graph data in the Graph Data editor (not in the graph itself). If you later make changes in the Graph Data editor, the graph updates automatically.
You can modify a graph’s data references (numbers, dates or durations) at any time. You can add and remove an entire data series, or edit a data series by adding or deleting specific data from it.
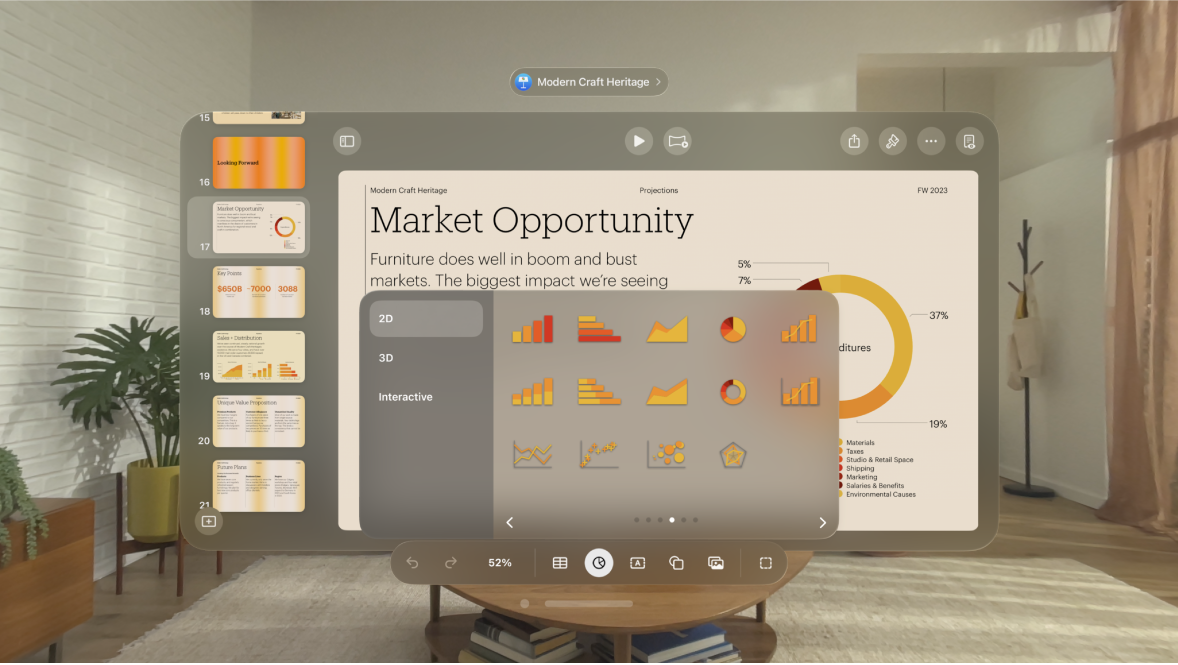
Add a graph
Tap

You can tap 2D or 3D to see the types of graphs you can add, then swipe left or right to see more options for each type of graph.
When you add a 3D graph, you see

To add data, tap

Enter data: Tap place holder text, then enter your own data.
Change whether rows or columns are plotted as a data series: Tap

If you added an interactive chart, to change the type of control used for interacting with the graph, tap the graph, tap


Add a Magic Graph effect to an interactive graph
You can animate the different data series in a graph with a Magic Chart build effect.
Tap the interactive graph, tap
Tap Magic Graph at the bottom of the window.
Tap Start, then tap an option:
On Tap: The Magic Graph effect plays when you tap the slide during the presentation.
After Transition: The Magic Graph effect plays when the slide opens during the presentation.
To see a preview of the animation, tap


Add or delete a data series
Tap the graph, tap
Do any of the following:
Add a data series: Tap cells, then enter the data for your new data series.
Remove a data series: Tap the bar for the row or column you want to delete, tap it again, then tap Delete.
Reorder data series: Pinch and drag the bar for the data series you want to move.
Tap


Switch rows and columns as data series
When you add a graph, Keynote defines the default data series for it. In most cases, if a table is square or if it’s wider than it is tall, the table rows are the default series. Otherwise, the columns are the default series. You can change whether rows or columns are the data series.
Tap the graph, tap
Tap
Tap Done to return to the graph.
Share the x-axis for multiple values along the y-axis for scatter and bubble charts
Sharing the x-axis means plotting a single kind of value along the x-axis, while allowing for multiple kinds of values plotted along the y-axis. By default, the x-axis values are shared among multiple sets of y-axis values in some types of graphs.
Tap the graph to select it, tap
Tap
Tap Done to return to the graph.
About graph downsampling
If a column, bar, line or area graph references a table with a large number of data points, the graph automatically shows a representative sample of each series to improve the performance of Keynote. Downsampling doesn’t change or remove the data in your table, and only changes the visible data points in the graph.
If your graph data is being downsampled, a message appears when you tap 
If you want to see certain data points in your graph, you need to create the graph from a smaller table or a smaller selection of data from a large table.