Filter network request data
The Network tab has many filters and navigation options that can be used to drill down to specific requests.
Note: If you want logs to persist on navigation, uncheck the default setting "Clear when page navigates” in the settings.
In the Network tab of Web Inspector, do any of the following:
Hide a column in the resource details list: Control-click a column header, then choose an item from the shortcut menu to remove its checkmark.
View time information for a network resource: Move the pointer over a blue bar in the last column of the resource details list until an info window appears.
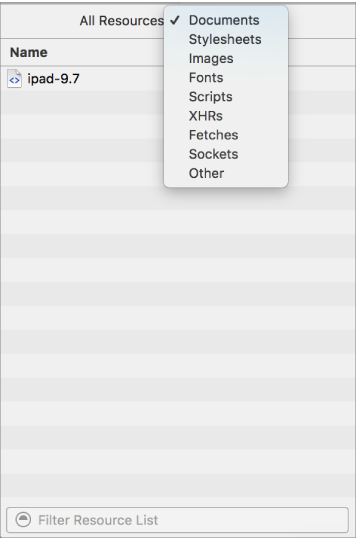
Filter resources by type: At the top of the navigation sidebar (on the left), click the pop-up menu, then choose a resource type.

Copy a resource's request as a cURL invocation: Control-click a resource in the list, then choose Copy as cURL from the shortcut menu.
View the contents of a resource: Move the pointer over the resource in the navigation sidebar (on the left), then click the right arrow that appears. The resource’s contents replace the details list view.
Return to the resource details list view: Click the left arrow button at the top of the Network tab, or click the “X” in the selected row in the sidebar.
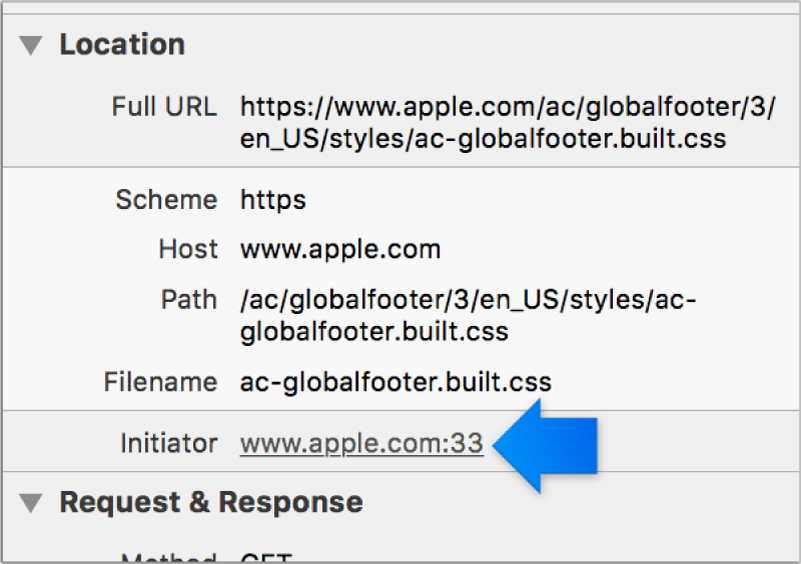
View more details about the request in the details sidebar: Click on a resource in the main content area to select it, and the details sidebar will automatically expand. This sidebar contains more information about how the resource was loaded and its initiator.
Select the initiator for a resource: Click on an Initiator link in the details sidebar to select the initiating resource and show it in the main table. You can use this to understand what caused a resource to be loaded.

If the inspected web content reloads or navigates away, resources from the previous navigation are cleared from the table. If the tab is empty, then you need to reload the page.