Toolbar Overview
At the top of Web Inspector is the toolbar. It allows a developer to see information and perform actions that are useful across many different tasks. It is currently not customizable.

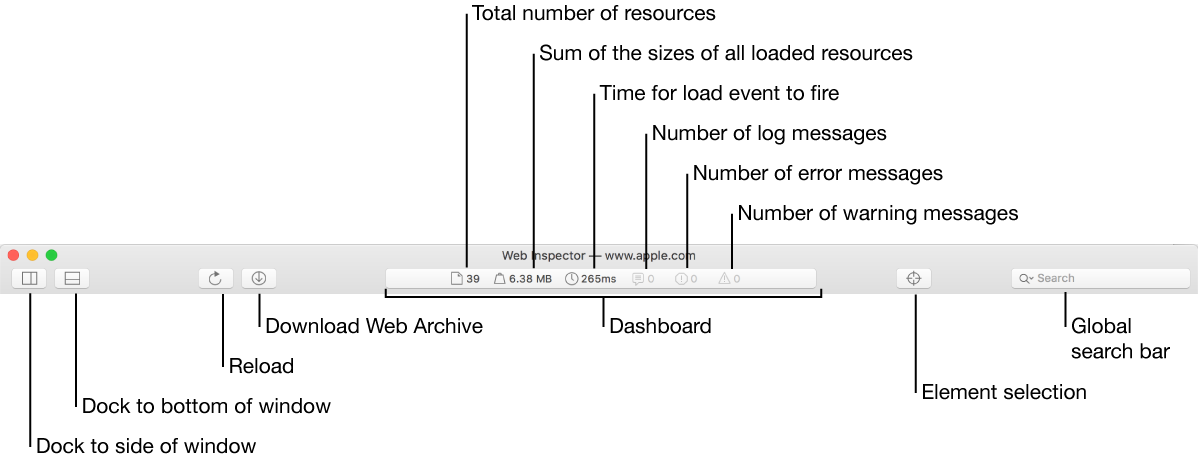
Dock to Side of window Docks Web Inspector to the right side of the browser window.
Dock to Bottom of window Docks Web Inspector to the bottom of the browser window. By default, Web Inspector docks to the bottom.
Tip: These docking options do not appear in the case of remote debugging.
Detach (not shown above) ![]() Moves Web Inspector to a separate window.
Moves Web Inspector to a separate window.
Reload Does a normal reload with a single click. If the Shift key is pressed when you click this button, then this feature does a forced origin reload of the main frame of your current web content and ignores caches. It is hidden when inspecting JavaScript running in a JSContext object.
Download Web Archive Adds all the active resources used by the current web content into a .webarchive file. A webarchive saves the current web content so it can be sent to other people. When the webarchive is opened on another computer, web content loads resources from the webarchive instead of downloading them over the network. This button is not available when inspecting a JSContext object.
Dashboard Provides an overview of page loading and console activity in the center of the toolbar. During some tasks that require frequent interaction—such as stopping the debugger—the default dashboard contents are replaced with task-specific buttons. Clicking one of the last three items in the dashboard will open the console and turn on the appropriate filters so that only console messages of the respective type are shown.
Note: The first three values only appear when inspecting web content. If Web Inspector was opened after the current web content finished loading, the page weight and load time will be empty until the next navigation. To recalculate this value, reload web content.
Element selection Allows you to enter Element Selection mode. In this mode, The topmost element underneath the cursor is highlighted with a light blue selector box, sometimes surrounded by green (padding), yellow (border), or orange (margin). Moving the pointer over an element displays its basic information: dimensions, HTML tag name, and class/id attributes. Clicking while in Element Selection mode causes Web Inspector to switch to the Elements tab, reveal the selected element, log it in the Inspector Console, and exit Element Selection mode.
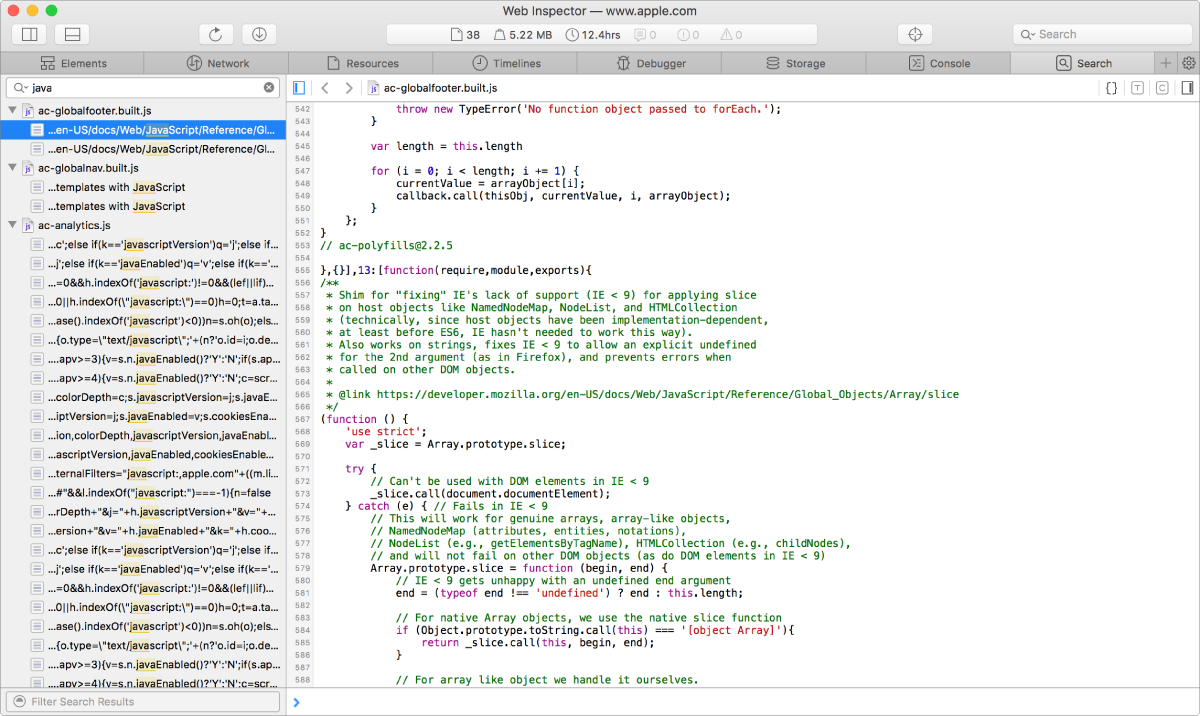
Global search bar Allows you to search in the resources of the inspected content. Web Inspector shows the search results in a temporary Search tab.

This tab can be reused across searches and can be closed when no longer needed. In this tab, the left sidebar lists the search results. Clicking on a result in this navigation sidebar shows the resource in the content area and reveals the line containing the result. You can filter these results with a search bar at the bottom of this sidebar.