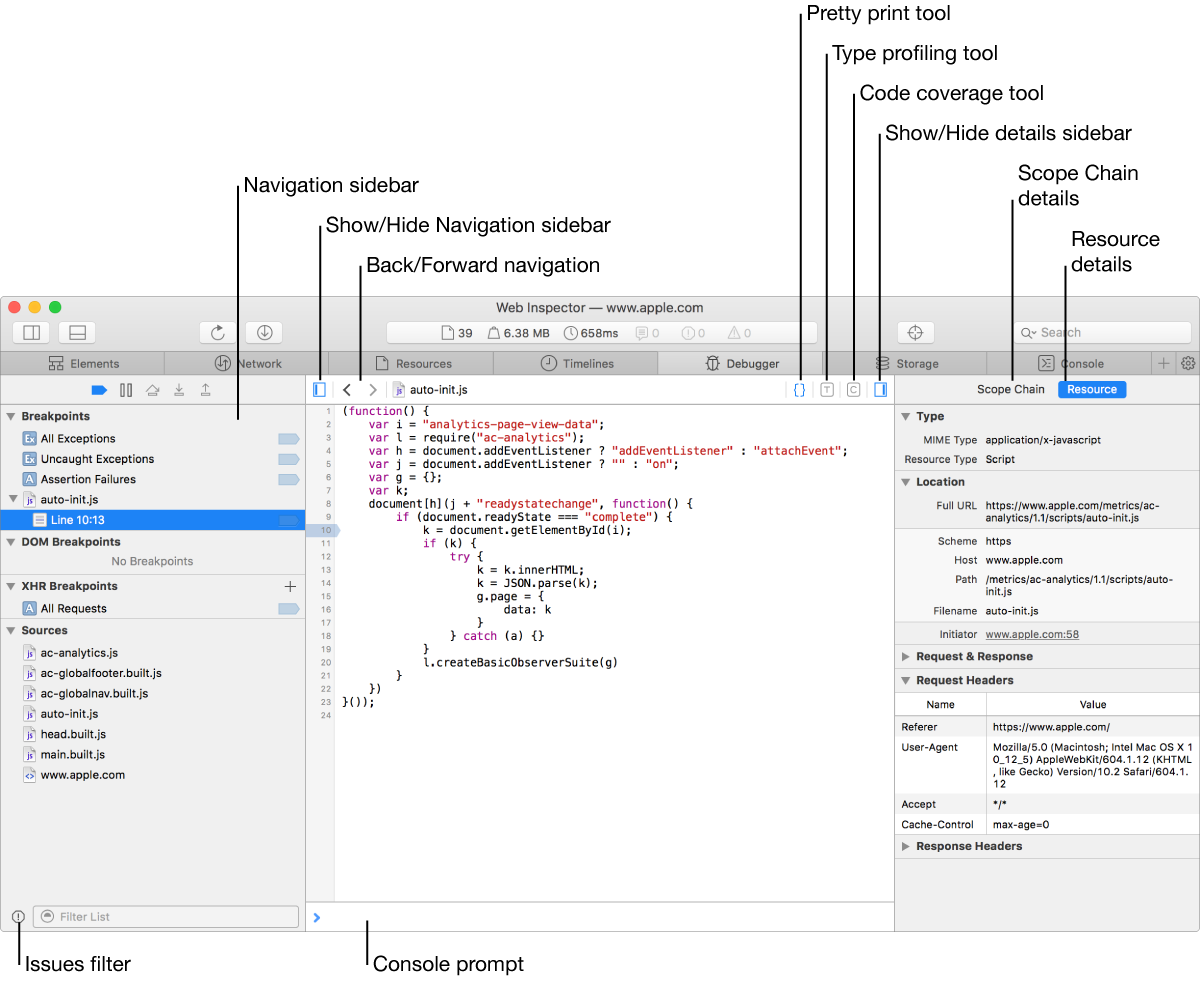
Debugger tab
The Debugger tab lets you examine the execution of JavaScript and observe control flow, variable types, and variable values.

Breakpoints Navigation sidebar Displays special global breakpoints and JavaScript, DOM, and XHR breakpoints set manually by you. It also has a Sources section, which shows the list of resources in which breakpoints can be set. This excludes CSS, Images, and so on but includes HTML files, which may have inline <script> tags. Warnings, errors, and issues reported by WebKit are shown underneath each resource. These messages are also reported to the Console, but here they are grouped by resource. To filter the Sources section of the sidebar, enter text in the field at the bottom of the sidebar.
Show/Hide Navigation sidebar Toggles the sidebar to the left of the tab.
Back/Forward navigation Allows you to quickly switch back to viewing previously shown content in the content area.
Pretty print tool Displays the code in a readable format. Works for JavaScript, CSS, and JSON.
Type profiling tool Helps you to visualize the observed, actual types that have already been assigned to a variable in JavaScript.
Code coverage tool Helps you to visualize which lines and expressions of JavaScript have been executed already. This is accurate at an expression-level.
Show/Hide details sidebar Shows and hides the sidebar containing details about the selected resource.
Details sidebar Shows information about the selected resource including type, image size, location, request and response, query parameters, request headers, and response headers.
Scope Chain details Displays the Scope Chain and Watch Expressions.
Resource details Displays information about the selected resource including type, image size, location, request and response, query parameters, request headers, and response headers.
Issues filter Shows the resources with warnings in them.
Console prompt Evaluate JavaScript quickly within any tab.

Enable/disable breakpoints Completely enables or disables all breakpoints.
Immediate Pause/Continue Pauses the debugger at the first statement of the next block of JavaScript that executes. This is typically at a top-level event (from Timelines tab) such as requestAnimationFrame or a DOM event listener.
Step over Pauses the debugger at the next expression to be evaluated within the current call frame or its parent frame. It does not descend into callees.
Step in Pauses the debugger at the next expression to be evaluated, even if it is within a callee function.
Step out Pauses the debugger at the next expression in the caller's call frame. It continues past any remaining expressions in the current call frame.