Add a JavaScript breakpoint
To add breakpoints to your code:

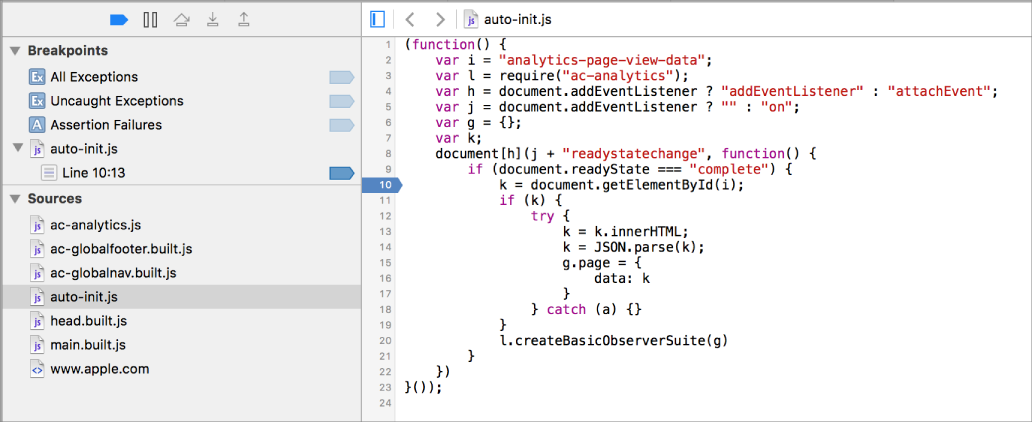
In the left sidebar of the Debugger tab, select a JavaScript or HTML file that contains inline scripts.
In the main pane, click the number in the gutter to the left of the code line where you want to create a breakpoint.
A dark blue marker is added to the number, indicating that when execution reaches this point, the debugger will pause. The left sidebar lists the breakpoint, its line number, and the resource file it was added to.
Note: The marker is opaque by default, which means the debugger will pause when execution reaches it. If it's medium blue, that means the breakpoint has the "Automatically continue after evaluating" option checked in Breakpoint Options. An even lighter blue means the breakpoint is disabled.