Keynote User Guide for Mac
- Welcome
- What’s new
-
- Get started with Keynote
- Intro to images, charts, and other objects
- Create a presentation
- Choose how to navigate your presentation
- Open or close a presentation
- Save and name a presentation
- Find a presentation
- Print a presentation
- Create a presentation using VoiceOver
- Change Keynote privacy and analytics settings
-
- Change object transparency
- Fill shapes and text boxes with color or an image
- Add a border to an object
- Add a caption or title
- Add a reflection or shadow
- Use object styles
- Resize, rotate, and flip objects
- Move and edit objects using the object list
- Add linked objects to make your presentation interactive
-
- Send a presentation
- Intro to collaboration
- Invite others to collaborate
- Collaborate on a shared presentation
- See the latest activity in a shared presentation
- Change a shared presentation’s settings
- Stop sharing a presentation
- Shared folders and collaboration
- Use Box to collaborate
- Create an animated GIF
- Post your presentation in a blog
-
- Use iCloud Drive with Keynote
- Export to PowerPoint or another file format
- Reduce the presentation file size
- Save a large presentation as a package file
- Restore an earlier version of a presentation
- Move a presentation
- Delete a presentation
- Password-protect a presentation
- Lock a presentation
- Create and manage custom themes
- Copyright

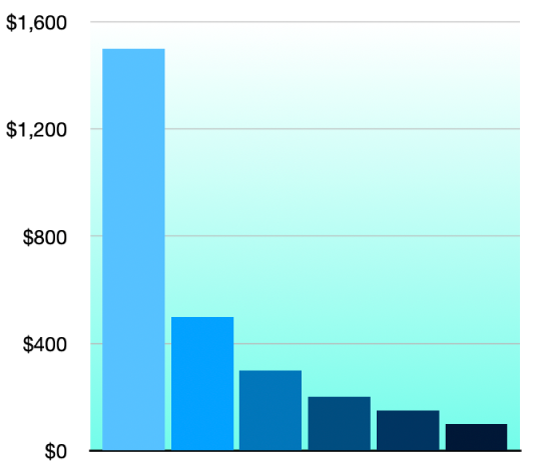
Add a border and background to a chart in Keynote on Mac
You can add a border and a background color to any 2D bar, column, area, or scatter chart.
Go to the Keynote app
on your Mac.Open a presentation, click the chart, then click the Chart tab in the Format
 sidebar.
In the Chart Options section of the sidebar, select the Border checkbox.
To add a background color to the chart or choose a style and color for the border, click the disclosure arrow next to Background & Border Style, then use the controls in that section.
Thanks for your feedback.