
Performance overview
Several tools in Web Inspector can help you improve the performance of your web content:
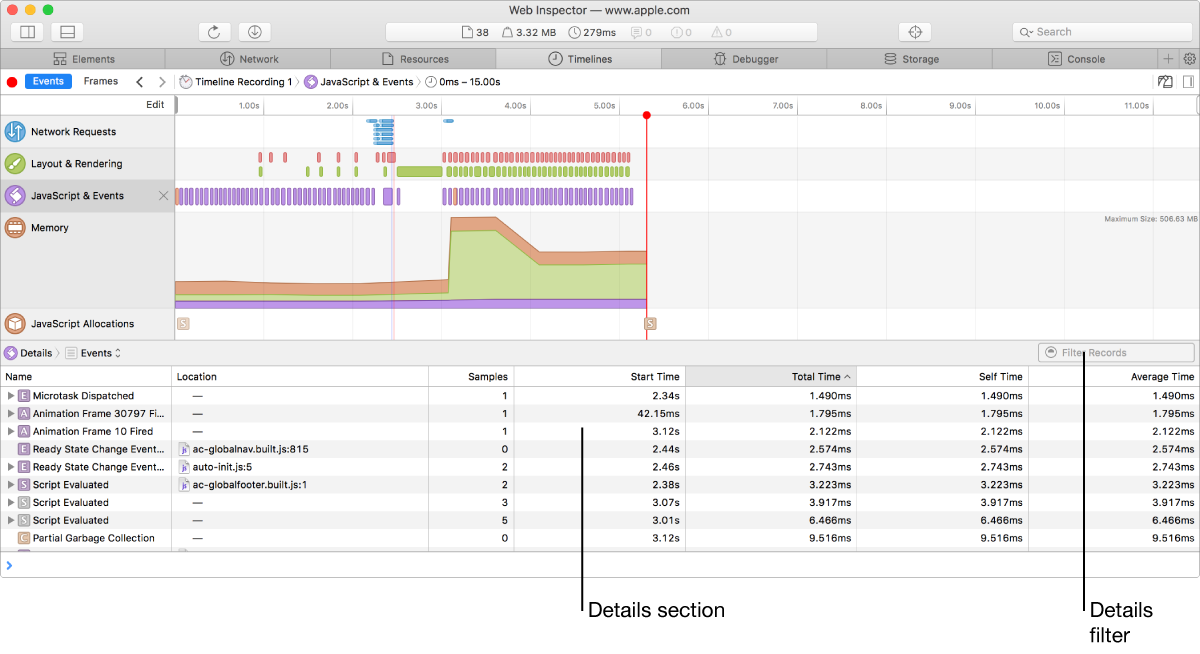
Timelines tab: Records web events or frames as they’re triggered over time, allowing you to gauge the performance of elements in a website. You can pick and choose multiple instruments that will best help you accomplish your goals. Each instrument has an associated scale for the x-axis. There are 5 potential instruments you can choose to record. They are Network Requests, Layout & Rendering, JavaScript & Events, Memory, and JavaScript Allocations . When you select a instrument, you can see more detail about it in the Details section below the overview of the recording. All instruments have a filter feature in the top corner of the Details section to select for certain records.
Elements Tab: Contains several tools for measuring the performance of compositing layers, including tools to visualize compositing borders, paint operations, and additional layers information in the Styles sidebar.