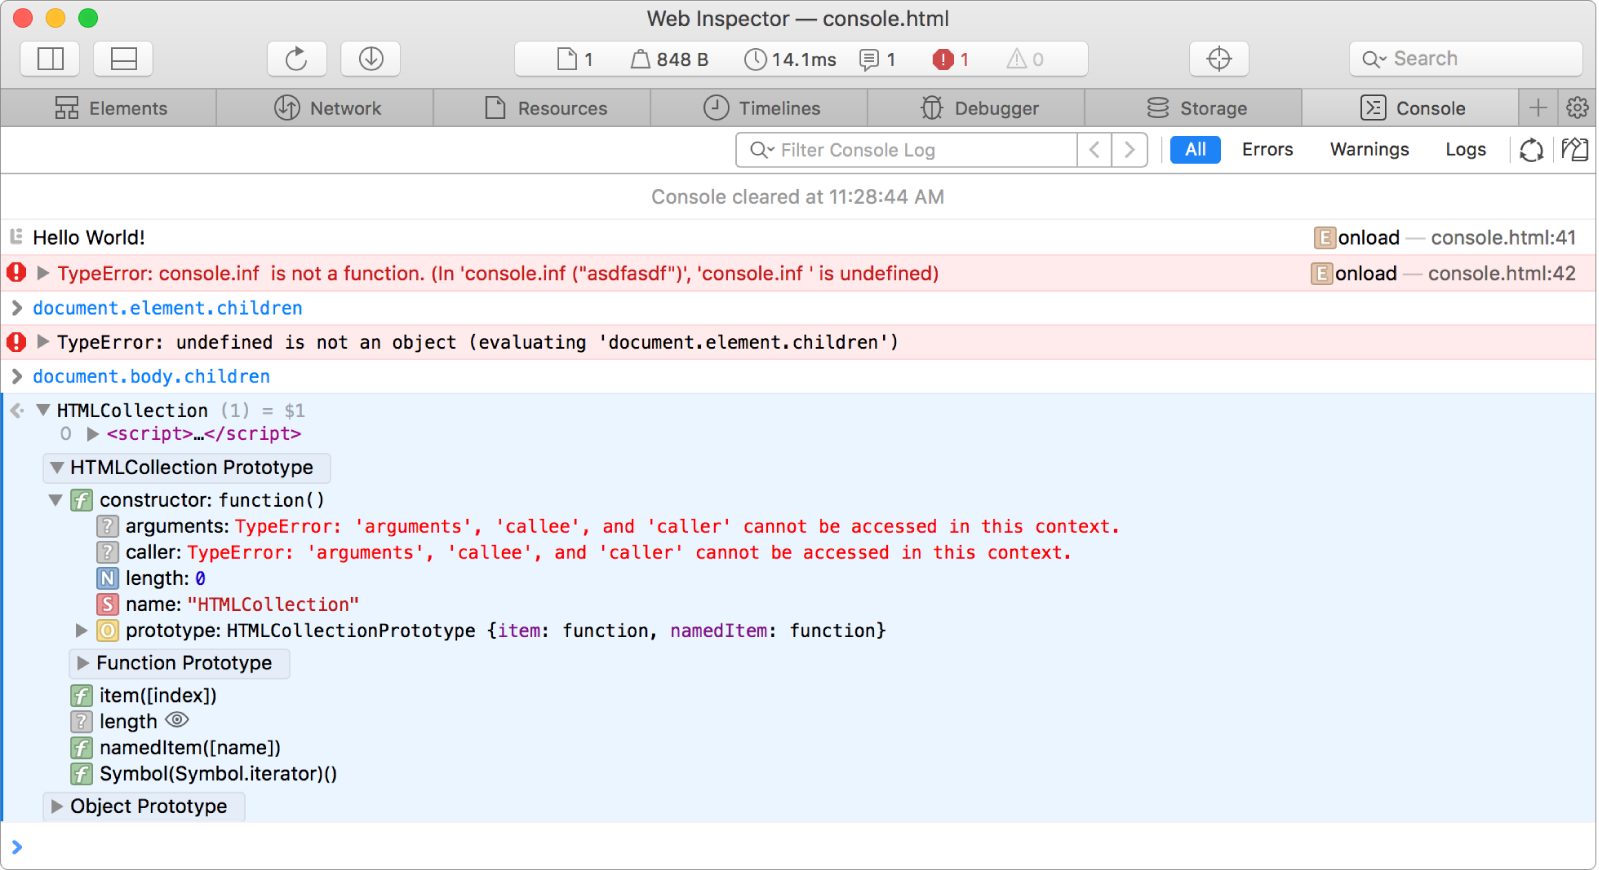
Console tab
The Console Tab serves two purposes: it shows messages that have been logged by web content, breakpoints, or other features; and it lets you enter and evaluate JavaScript code in the global scope or in the current scope where the debugger is paused.

The console has three positions:
Console prompt (shown at the bottom of the content area in every tab)
Split Console (shown in the lower half of the tab and splits the window; not available in every tab)
Console Tab (takes up the entire main content area)
The Split Console automatically appears when you evaluate something in the console prompt. Clicking the double arrow in the console prompt’s filter bar will expand the console to full height and switch to the Console Tab.

Filter Console Log field Type a string in this field to filter all the console messages (but not evaluations).
Console message filters Click the All, Errors, Warnings, and Logs buttons to filter console messages by category. Filters only apply to console messages logged by web content or Web Inspector features. Any expressions you’ve typed in or evaluation results will not be hidden by filters.
Note: You can select multiple category filters by command-clicking them. The All button resets any selected filters.
Collect garbage Triggers a garbage collection. Any objects that have no references are collected.
Clear Log Clears all console messages and evaluation results.
Note: If you want logs to persist on navigation, uncheck the default setting “Clear when page navigates” in the settings.