Improve rendering performance
You can improve rendering performance in your web content using tools in the Timelines tab and the Elements tab.
Rendering tasks include painting—drawing pixels into a layer—and compositing, which combines multiple layers into a flat image. Thus, a compositing task can have many child paint tasks.
View Layout & Rendering Instrument details in the Timelines tab
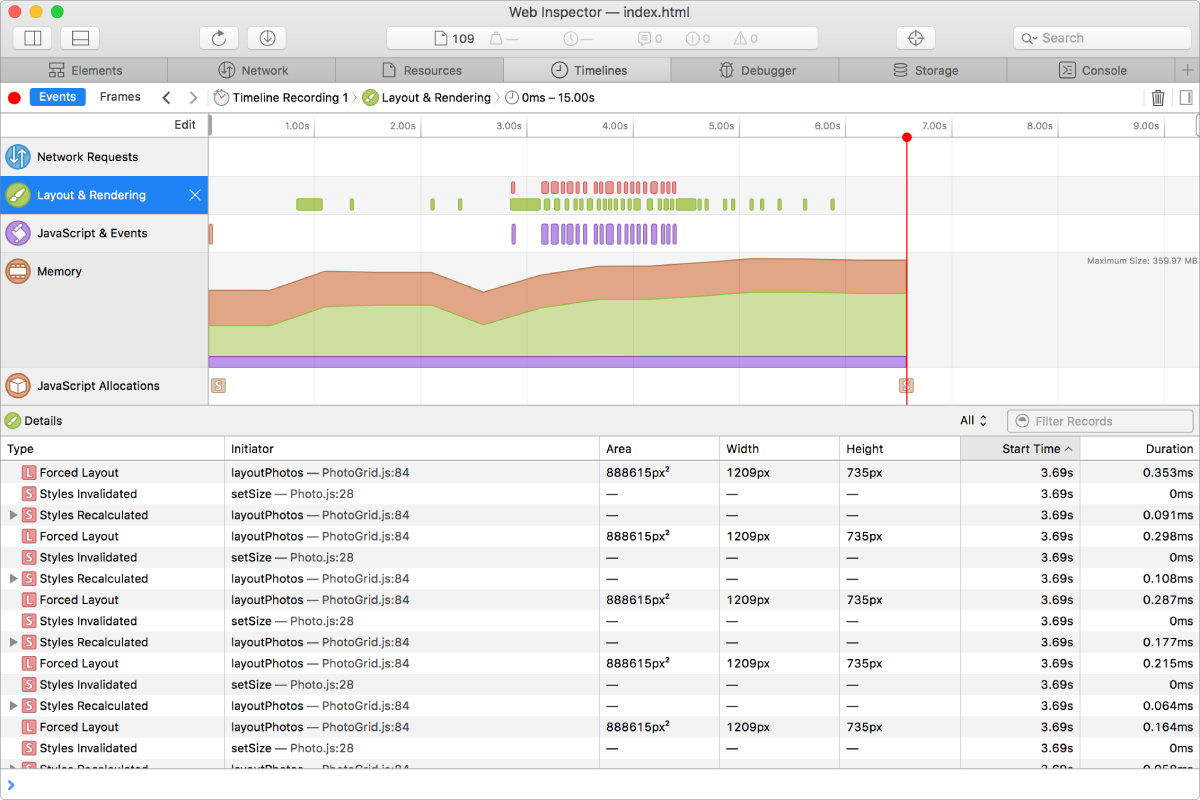
The Layout & Rendering instrument helps you understand how time is being spent performing page layout, painting, and compositing. There is also a filter feature so you can examine certain changes more closely, such as Styles Invalidated or Styles Recalculated. The timeline contains markers to denote times when lots of layout and rendering tasks were performed, and can stretch to include many discrete tasks listed in the data table.
After recording a timeline in the Timelines tab, select Layout & Rendering in the sidebar.

The Layout & Rendering row in the timeline contains markers that show when rendering and layout events took place. There are two kinds of markers:
Red markers are used for CSS cascade and page layout events.
Green markers are used for painting and compositing events.
In the data table, layout and rendering tasks are shown with their start time and duration. This allows you to find the most expensive operations and investigate those first.
Each paint task has an associated size and position; selecting a paint record in the data table highlights the region that was painted in the inspected web content.
Layout and forced layout tasks include a region that bounds the extent of the page that is affected by the layout. In some situations where layout is directly caused by a JavaScript call, layout tasks include a call stack in the Initiator column. To see the full call stack and jump to source locations that led to a layout task, select the record and move the pointer over the Initiator cell.
View Layers Section in the Elements tab
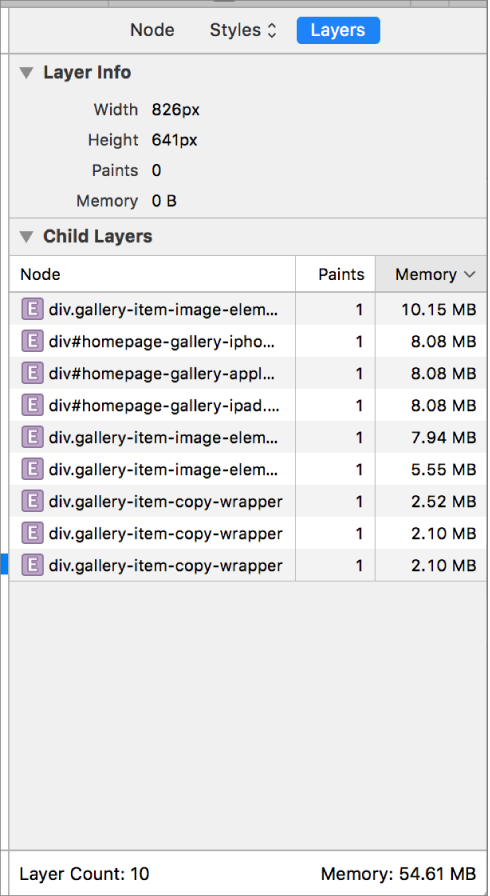
In the main content area of the Elements tab, select an element, then click Layers in the right sidebar.
If the selected DOM element has its own compositing layer, the Layer Info section lists its dimensions, number of paints, and decoded size in memory.

If the selected DOM element has descendants with their own compositing layers, each of them is listed in the Child Layers section. You can see all compositing layers in the document by selecting the root DOM element (<html>). Each child layer has a row in the Child Layers section. For each child layer, the layer’s element (derived from the tag name, id, and class attributes), number of repaints, and approximate size in memory is listed.
Most DOM elements do not receive their own compositing layers because layers consume extra memory. To understand why WebKit needed to create a compositing layer for an element, select the layer in the Child Layers section. A pop-up window lists the reasons why the compositing layer was necessary. The bottom of the Layers section shows the number and total memory usage of all child layers in the table.
Enable Paint Flashing feature in the Elements tab
To enable paint flashing, click the paint brush button in the top-right corner of the Elements tab.
When this feature is turned on, every time an element is redrawn, the painted region flashes with a quickly-fading translucent red color. Areas that redraw very frequently such as animations or media, will have a solid red appearance because they redraw before the flash completely fades.
Enable Compositing Borders feature in Elements tab
To enable compositing borders, click the Show/Hide Compositing Borders button in the upper-right corner of the Elements tab.
This feature makes it possible to see how the rendering engine divides your web content into layers before sending them to the compositor. Knowing where and what type of layers are used is important when trying to diagnose rendering performance problems.
Every composited layer gets a border; the color of the border indicates the type of a compositing layer.
Blue: Layers with blue borders indicate page tiles.
Green: Layers with green borders have a compositing layer with its own painted content.
Orange: Layers with orange borders have a backing store and extend partially offscreen, so they are converted to tiled layers.
Pale Blue: Layers with pale blue borders are clipped layers.
Light Blue and Dark Blue: Layers with two overlapping light blue and dark blue borders show compositing indicators that this image is being mapped directly into the backing store without having to be painted.
Yellow: Container layers have blue borders with a yellow inner border.
Bright Pink: Elements with backdrop filters have bright pink borders.
Each compositing layer also has a repaint counter in the top-left corner. It increments when the layer has been repainted. If the number is red, then the painting is happening via the normal optimized code path that takes advantage of Core Animation’s GPU-accelerated drawing. If the number is white, then the painting is happening via a less efficient CPU-based rendering.