Network tab
The Network tab shows all of the resources that were loaded by the current webpage while Web Inspector was open.
Note: The Network tab is not available if you are inspecting JSContext objects.

Navigation sidebar Filter resources in the navigation sidebar. The filter bar at the bottom of this sidebar shows only resources that match an entered string. The pop-up menu at the top of this sidebar lets you filter by resource type.
Show/Hide Navigation sidebar Toggles the sidebar to the left of the tab.
Back/Forward navigation Allows you to quickly switch back to viewing previously shown content in the content area.
Resource details list This table is the main part of this tab. It uses one row per resource, to show details about each request and response. The first field lists the resource's name and has a hoverable jump arrow to the resource contents. The last field visualizes the amount of time elapsed for the resource request and response using a bar graph.
Console prompt Evaluate JavaScript quickly within any tab.
Note: If you want logs to persist on navigation, uncheck the default setting "Clear when page navigates” in the settings.

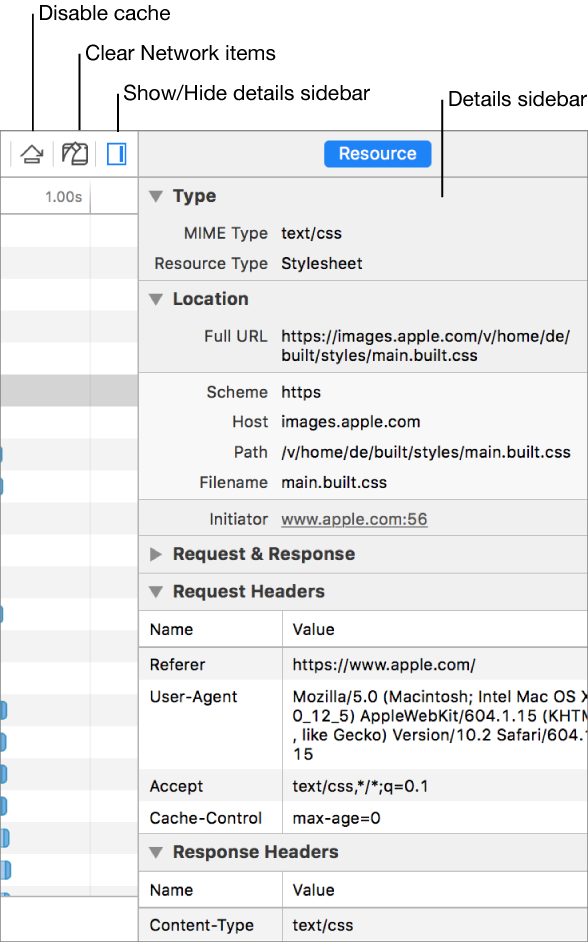
Disable cache Forces all requests to be loaded without using any cached resources in the disk or memory cache. This is effective for loads triggered by the inspected page.
Clear Network items Clears all the listed resources in the Network tab.
Show/Hide details sidebar Shows and hides the sidebar containing details about the selected network request.
Details sidebar Shows information about the selected request including type, image size, location, request and response, query parameters, request headers, and response headers.
Important: To see additional details about a selected resource, move the pointer over the name of a request in a particular row, then click the right arrow ![]() that appears.
that appears.