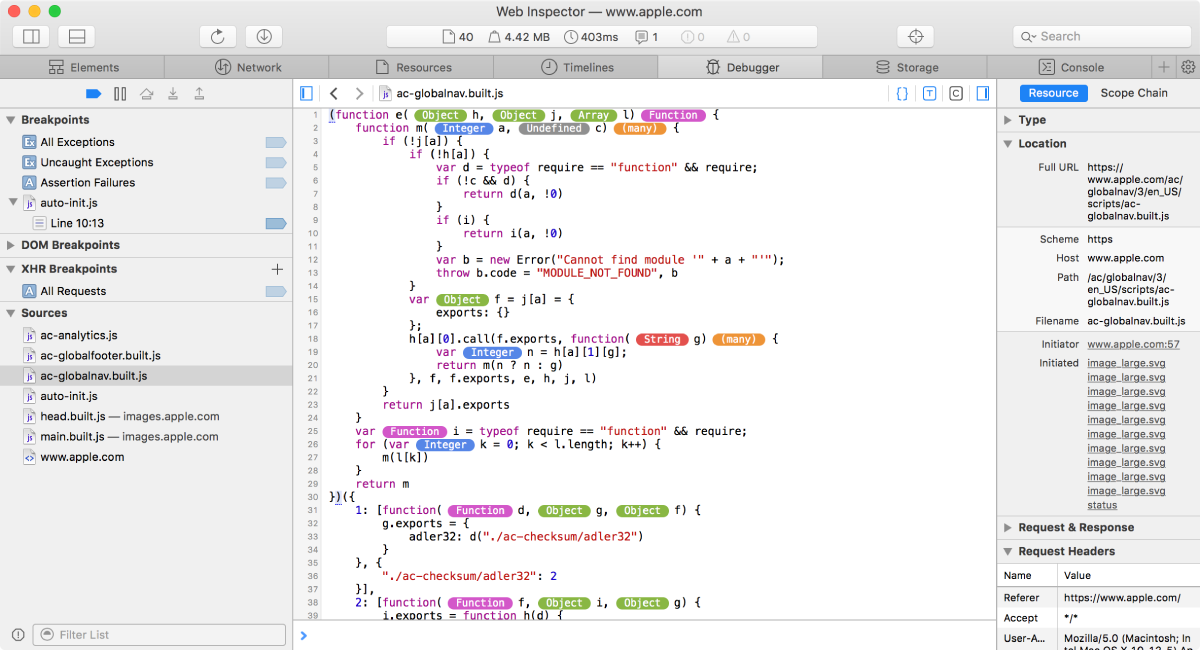
Highlight type and code coverage during code execution
The type profiling and code coverage tools in the Resources tab and Debugger tab can help you visualize types and code execution in your JavaScript resource files. After you enable one of these tools, reload web content to restart code execution.
Turn on type profiling
In the Resources tab or the Debugger tab, choose a JavaScript resource and click the “T” button in the top-right corner of the main content area.
With type profiling enabled, the JavaScript engine tracks actual types assigned to every variable in your JavaScript code. As this data is collected, it’s presented in the main content area as type bubbles next to variables, function parameters, and function return types. Type bubbles are color-coded according to the type(s) that have been observed at that variable/parameter/return value:
Red: Strings
Green: Objects and data structures
Purple: Functions and booleans
Blue: Integers
Orange: Variables with multiple types
Gray: Undefined

If the variable has one type but is sometimes undefined, a question mark is appended to the type name. If the variable has many different types, the bubble displays (many). Move the pointer over any type bubble to see what type was observed for that variable. Variables that have had an Object type also list the properties that were seen on the object, so you can get a sense for what sorts of data were processed in the code.
Turn on code coverage
In the Resources tab or the Debugger tab, choose a JavaScript resource , then click the “C” button in the top-right corner of the main content area.
With code coverage enabled, as web content loads, code that has been executed at least once has a normal appearance, and code that has never executed is dimmed. This is accurate at an expression level.