Improve resource load time
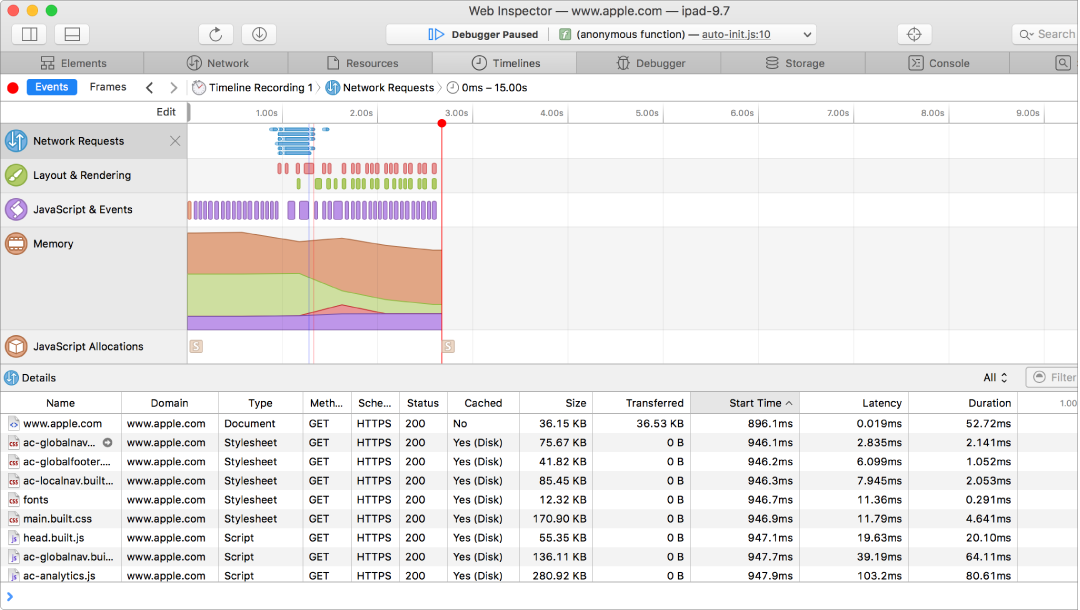
You can improve resource load time for your web content using the Network Requests instrument in the Timelines tab. The Network Requests instrument visualizes resource loading over time. It is keyed by resource, and shows both the request and response timings within the same row.
After recording a timeline in the Timelines tab, select Network Requests in the sidebar.

Light blue bars represent time spent sending the request and waiting.
Dark blue bars represent time receiving the response data.
The timeline has 6 tracks and can show up to 6 simultaneous load operations. This is only a limitation of the visualization so that it fits in a bounded height—Safari can load more than 6 resources at a time. There is also a filter feature so you can show only certain types of resources, such as Documents or Scripts.
The Details section for this instrument shows statistics for each loaded resource, similar to those shown in the Network tab: how long it took to get each resource, the size of each resource, and the latency of the server.