Pages User Guide for Mac
- Welcome
- What’s new
-
- Use iCloud Drive with Pages
- Export to Word, PDF, or another file format
- Open an iBooks Author book in Pages
- Reduce the document file size
- Save a large document as a package file
- Restore an earlier version of a document
- Move a document
- Delete a document
- Lock a document
- Password-protect a document
- Create and manage custom templates
- Copyright

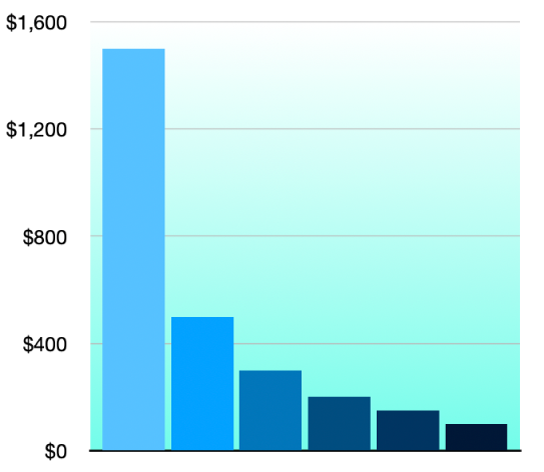
Add a border and background to a chart in Pages on Mac
You can add a border and a background color to any 2D bar, column, area, or scatter chart.
Go to the Pages app
on your Mac.Open a document, click the chart, then click the Chart tab in the Format
 sidebar.
In the Chart Options section of the sidebar, select the Border checkbox.
To add a background color to the chart or choose a style and color for the border, click the disclosure arrow next to Background & Border Style, then use the controls in that section.
Thanks for your feedback.