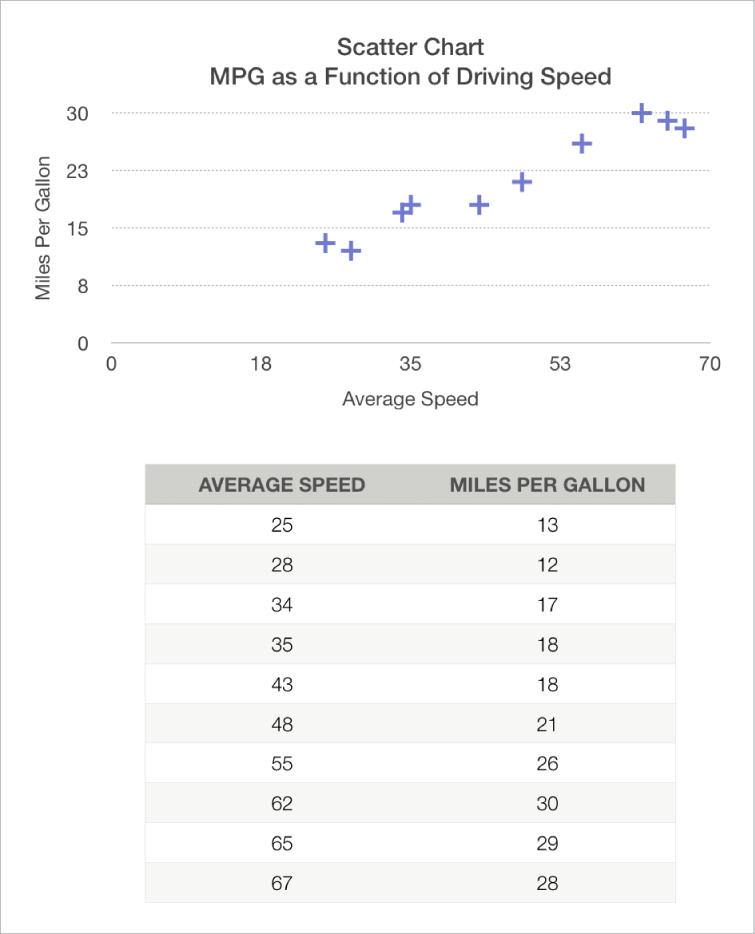
Add scatter and bubble charts in Numbers on iPad
To create any type of chart, you can add a chart to a sheet first, then select the table cells with the data you want to use. Or, you can select the data first, then create a chart that displays the data. Either way, when you change the data in the table, the chart updates automatically.
Tip: You can learn about different chart types in the Charting Basics template. With the document manager in browse view, tap Choose a Template, then tap Charting Basics in the Basic template category. Tap the tabs near the top of the template (Column and Bar Charts, Interactive Chart, and so on) to view the different sheets—each sheet explains a different type of chart.
You can change the data reflected in the chart at any time. To learn how, see Modify chart data.

