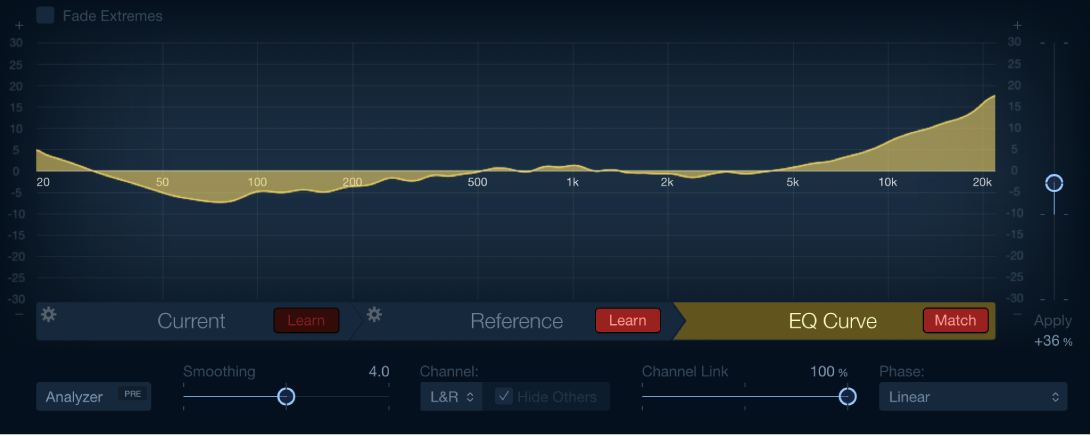
Match EQ controls in Final Cut Pro
Match EQ offers the following controls.
For information about adding the Match EQ effect to a clip and showing the effect’s controls, see Add Logic effects to clips in Final Cut Pro.

Fade Extremes checkbox: Select to automatically reduce the level of high-amplitude spikes in the analyzed signal.
Main display: Displays the filter curve created by matching the template to the current material. You can also edit the filter curve directly (see Edit the Match EQ filter curve in Final Cut Pro).
Scale display: Drag the scale to set the 0 dB reference line and scaling in the main display.
Mode buttons: Set the information shown in the graphic display. The choices are:
Current: Displays the frequency curve for the audio learned as current material. This is shown in green.
Reference: Displays the learned frequency curve template for the source file. This is shown in purple.
EQ Curve: Displays the filter curve created by matching the template and the current material. This is shown in yellow.
Action menu: Choose and execute commands from the Current or Reference Action menu.
Clear: Clears the Current Material Spectrum or Reference Spectrum.
Copy: Copies the Current Material Spectrum or Reference Spectrum to the Clipboard.
Paste: Pastes the Current Material Spectrum or Reference Spectrum from the Clipboard.
Load: Loads the Current Material Spectrum or Reference Spectrum from a settings file.
Generate: Creates a Current Material Spectrum or Reference Spectrum from an audio file.
Current Learn button: Start or stop the process of learning the frequency spectrum of the project you want to match with the source file or input.
Reference Learn button: Start or stop the process of learning the frequency spectrum of the source file or input.
EQ Curve Match button: Match the frequency spectrum of the current material to that of the template (source) file.
Analyzer button: Turn the Analyzer function on or off.
Analyzer Pre/Post button: Choose whether the Analyzer looks at the signal before (Pre) or after (Post) the filter curve is applied.
Smoothing slider and field: Set the amount of smoothing for the filter curve, using a constant bandwidth set in semitone steps. A value of 0.0 has no impact on the filter curve. A value of 1.0 means a smoothing bandwidth of one semitone. A value of 4.0 means a smoothing bandwidth of four semitones (a major third). A value of 12.0 means a smoothing bandwidth of one octave, and so on.
Note: Smoothing has no effect on any manual changes you make to the filter curve.
Channel pop-up menu: Choose whether separate curves are displayed by the Analyzer. Choose L&R for stereo or an individual L or R channel. In surround instances, choose All or an individual channel. Changes to the filter curve affect the chosen channel when a single channel is selected.
Note: The Hide Others and Channel Link parameters are disabled when you use the effect on a mono channel.
Hide Others checkbox: Hide or show other channels when an individual channel is chosen in the Channel pop-up menu. The visible impact of this parameter is directly tied to the Channel Link slider value.
Note: The Hide Others parameter is disabled when you use the effect on a mono channel.
Channel Link slider and field: Refine settings made with the Channel pop-up menu.
When Channel Link is set to 100%, all channels are represented by a common EQ curve.
When Channel Link is set to 0%, a separate filter curve is displayed for each channel (chosen with the Channel pop-up menu).
Settings between 0 and 100% blend these values with your filter curve changes for each channel. This results in a hybrid curve.
Note: The Channel Link parameter is disabled when you use the effect on a mono channel.
Phase pop-up menu: Choose the operational principle of the filter curve.
Linear: Prevents processing from altering the signal phase, but latency is higher.
Minimal: Alters the signal phase (slightly), but latency is reduced.
Minimal, Zero Latency: Adds no latency, but has a higher CPU overhead than the other options.
Apply slider and field: Determine the impact of the filter curve on the signal.
Values above 100% magnify the effect.
Values below 100% reduce it.
Negative values (−1% to −100%) invert the peaks and troughs in the filter curve.
A value of 100% has no impact on the filter curve.
LFE Handling buttons (Extended controls area): In surround instances, click to process or bypass the LFE channel.