Improve memory performance
You can improve memory performance of your web content by assessing data in the Memory and JavaScript Allocations categories in the Timelines tab.
View Memory Instrument details in the Timelines tab
After recording a timeline in the Timelines tab, select Memory in the sidebar.

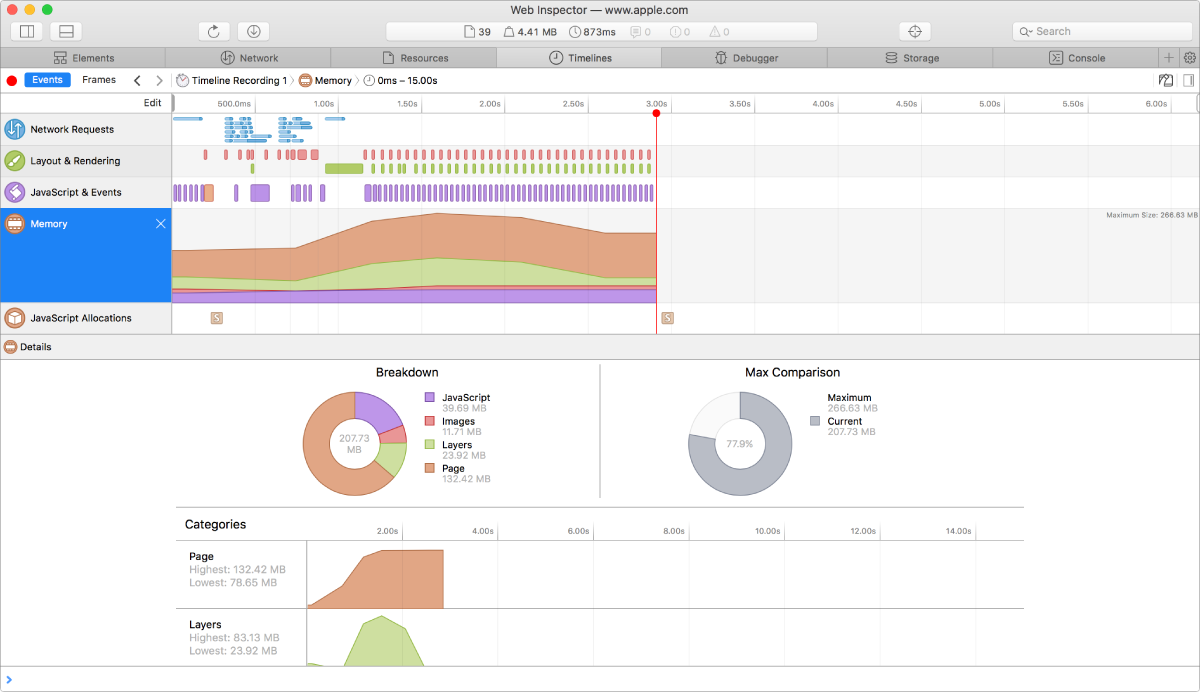
The Memory instrument shows a stacked line graph of relative memory usage over time and the relative memory use of different activities. When you select this instrument, you can see memory usage charts in the Details section.
Each color represents a category of memory use:
Purple: JavaScript
Red: Images
Green: Layers
Orange: Page activities
The Breakdown chart shows how much memory is allocated for JavaScript, for images, for the layers, and for the rest of the engine-related page memory such as DOM elements, audio, media, canvas, and so on. The Max Comparison chart shows peak and current memory usage by web content. The Categories section shows line charts of memory usage over time for each category.
View JavaScript Allocations Instrument details in the Timelines tab
After recording a timeline in the Timelines tab, select JavaScript Allocations in the sidebar.

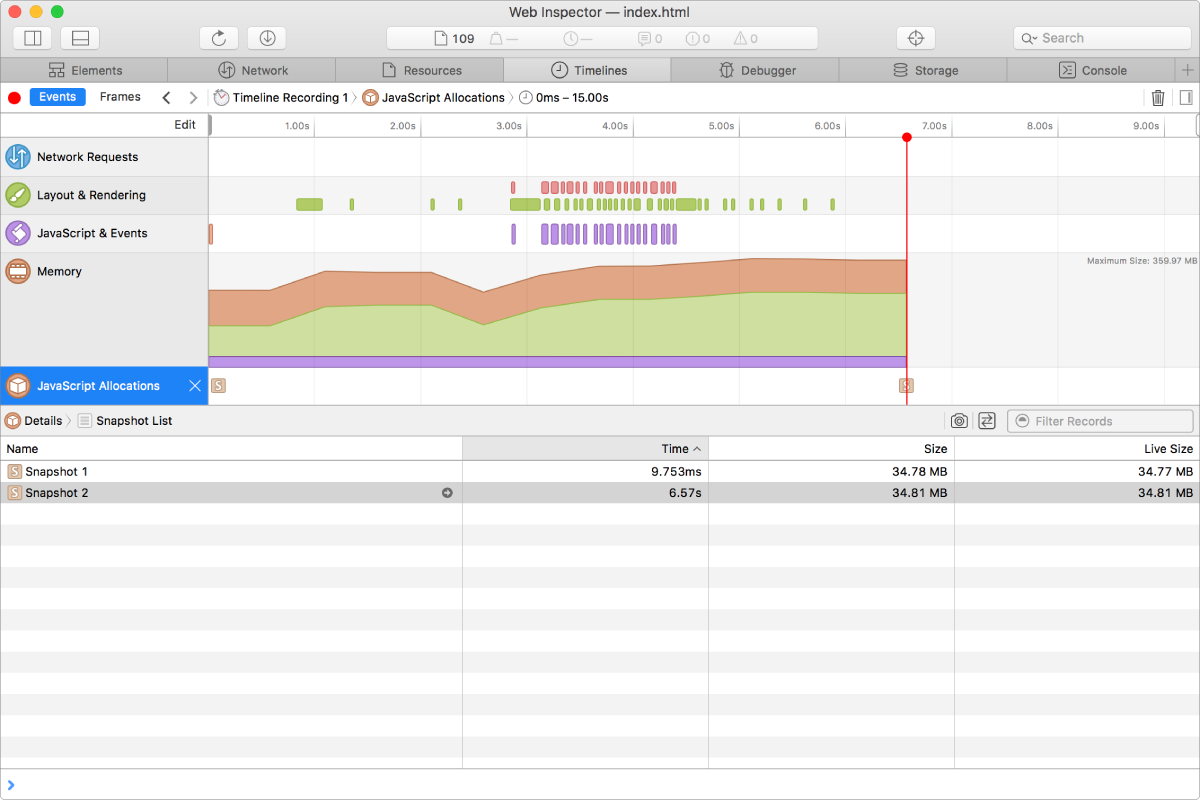
The JavaScript Allocations instrument helps you understand which objects use a lot of memory, address memory leaks, find out why an object is still alive, and more.
This instrument and its Details section display heap snapshots (quick captures of the JavaScript heap at specific moments) to show memory usage growing over time. By default, a snapshot is taken when recording starts, every 10 seconds thereafter, and when recording ends. You can also trigger snapshots directly from your JavaScript code with console.takeHeapSnapshot. Adding this statement does not affect the performance of your code; this statement operates only when Web Inspector is open. You can also manually take snapshots during the recording period with the Take Snapshot button.

To compare two snapshots, click the Compare Snapshots button, then select two snapshots. By comparing snapshots over time, you can identify unnecessary allocations quickly and modify your code to eliminate them.

Select a snapshot from the Details section by clicking on the jump arrow next to the snapshot name or by clicking on a ![]() snapshot icon in the JavaScript Allocations overview. A snapshot can be viewed in two ways: as a summary of object instances, or as an object graph. The jump bar allows you to switch between these views.
snapshot icon in the JavaScript Allocations overview. A snapshot can be viewed in two ways: as a summary of object instances, or as an object graph. The jump bar allows you to switch between these views.
The Instances view is useful for finding unexpected copies of objects and understanding their contents. This view sorts all JavaScript objects in the heap snapshot according to their prototype object. Expanding an object prototype row shows all instances of that prototype in the snapshot.
Each object instance includes the Retained Size (how much memory this object is referencing and preventing from being freed), Self Size (the size of this object by itself), and a preview of the object's contents. Each object instance can be expanded recursively to see what objects it has references to. Each object in the snapshot is assigned a unique identifier of the form @12345. Move the pointer over an object identifier to reveal a computed property path—a chain of references from a root object (such as window) to the object instance. If you expected this object to be garbage collected, this property path can provide clues as to which object(s) have a reference and are keeping the instance alive.