Pages
Pages User Guide for iPhone
- Welcome
- Copyright

Add a border and background to a graph in Pages on iPhone
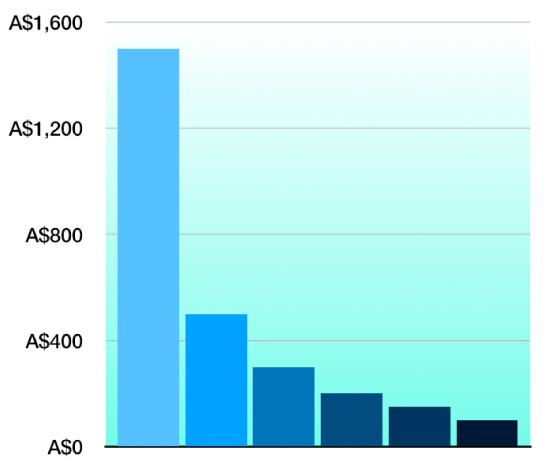
You can add a border and a background colour to any 2D bar, column, area or scatter plot.
Tap the graph, then tap
 .
.Tap Style, then do any of the following:
Add a background: Tap General, tap Background, then tap Preset, Colour, Gradient or Image and use the controls to adjust the look of the background.
Add a border: Tap Gridlines, then turn on Graph Border.
Note: These options vary depending on the type of graph and data.
Thanks for your feedback.