Keynote
Keynote User Guide for Mac
- Welcome
-
- Send a presentation
- Intro to collaboration
- Invite others to collaborate
- Collaborate on a shared presentation
- See the latest activity in a shared presentation
- Change a shared presentation’s settings
- Stop sharing a presentation
- Shared folders and collaboration
- Use Box to collaborate
- Create an animated GIF
- Post your presentation in a blog
-
- Use iCloud Drive with Keynote
- Export to PowerPoint or another file format
- Reduce the presentation file size
- Save a large presentation as a package file
- Restore an earlier version of a presentation
- Move a presentation
- Delete a presentation
- Password-protect a presentation
- Lock a presentation
- Create and manage custom themes
- Copyright

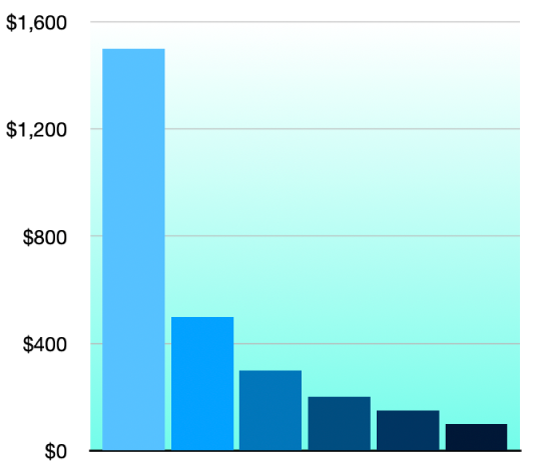
Add a border and background to a chart in Keynote on Mac
You can add a border and a background color to any 2D bar, column, area, or scatter chart.
Click the chart, then in the Format
 sidebar, click the Chart tab.
In the Chart Options section of the sidebar, select the Border checkbox.
To add a background color to the chart or choose a style and color for the border, click the disclosure arrow next to Background & Border Style, then use the controls in that section.
Thanks for your feedback.