Numbers User Guide for iPad
- Welcome
- What’s new
-
- Get started with Numbers
- Intro to images, charts, and other objects
- Create a spreadsheet
- Open spreadsheets
- Prevent accidental editing
- Personalize templates
- Use sheets
- Undo or redo changes
- Save your spreadsheet
- Find a spreadsheet
- Delete a spreadsheet
- Print a spreadsheet
- Change the sheet background
- Copy text and objects between apps
- Customize the toolbar
- Touchscreen basics
- Use Apple Pencil with Numbers
- Change Numbers privacy and analytics settings
- Copyright

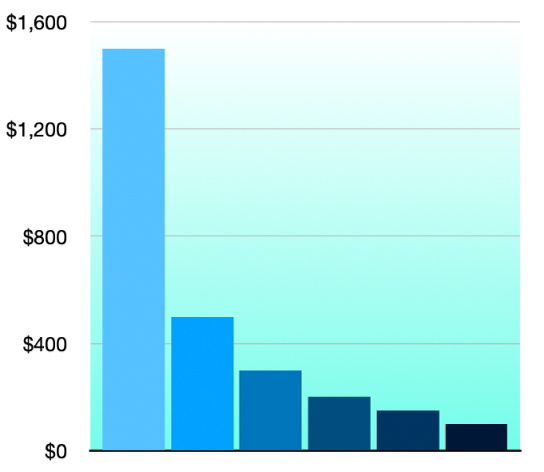
Add a border and background to a chart in Numbers on iPad
You can add a border and a background color to any 2D bar, column, area, or scatter chart.
Go to the Numbers app
 on your iPad.
Open a spreadsheet, tap the chart, then tap
 .
.Tap Style, then do any of the following:
Add a background: Tap General, tap Background, then tap Preset, Color, Gradient, or Image and use the controls to adjust the look of the background.
Add a border: Tap Gridlines, then turn on Chart Border.
Note: These options vary depending on the type of chart and data.
You can also add a border around your sheet. To learn more, see Add a border around a sheet.
Thanks for your feedback.