Final Cut Pro User Guide for Mac
- Welcome
- What’s new
-
- Intro to importing media
- If it’s your first import
- Organize files during import
-
- Import from Image Playground
- Import from iMovie for macOS
- Import from iMovie for iOS or iPadOS
- Import from Final Cut Pro for iPad
- Import from Final Cut Camera
- Import from Photos
- Import from Music
- Import from Apple TV
- Import from Motion
- Import from GarageBand and Logic Pro
- Import using workflow extensions
- Record into Final Cut Pro
- Memory cards and cables
- Supported media formats
-
- Intro to effects
-
- Intro to transitions
- How transitions are created
- Add transitions and fades
- Quickly add a transition with a keyboard shortcut
- Set the default duration for transitions
- Delete transitions
- Adjust transitions in the timeline
- Adjust transitions in the inspector and viewer
- Merge jump cuts with the Flow transition
- Adjust transitions with multiple images
- Modify transitions in Motion
- Add adjustment clips
-
- Add storylines
- Use the precision editor
- Conform frame sizes and rates
- Use XML to transfer projects
- Glossary
- Copyright and trademarks
Histogram display options in Final Cut Pro for Mac
The histogram provides a statistical analysis of the image by calculating the total number of pixels of each color or luma level and creating a graph that shows the number of pixels at each percentage of luma or color. Each increment of the scale from left to right represents a percentage of luma or color, and the height of each segment of the histogram graph shows the number of pixels that correspond to that percentage.
The Scope menu ![]() in the upper-right corner of the histogram provides a variety of display options:
in the upper-right corner of the histogram provides a variety of display options:
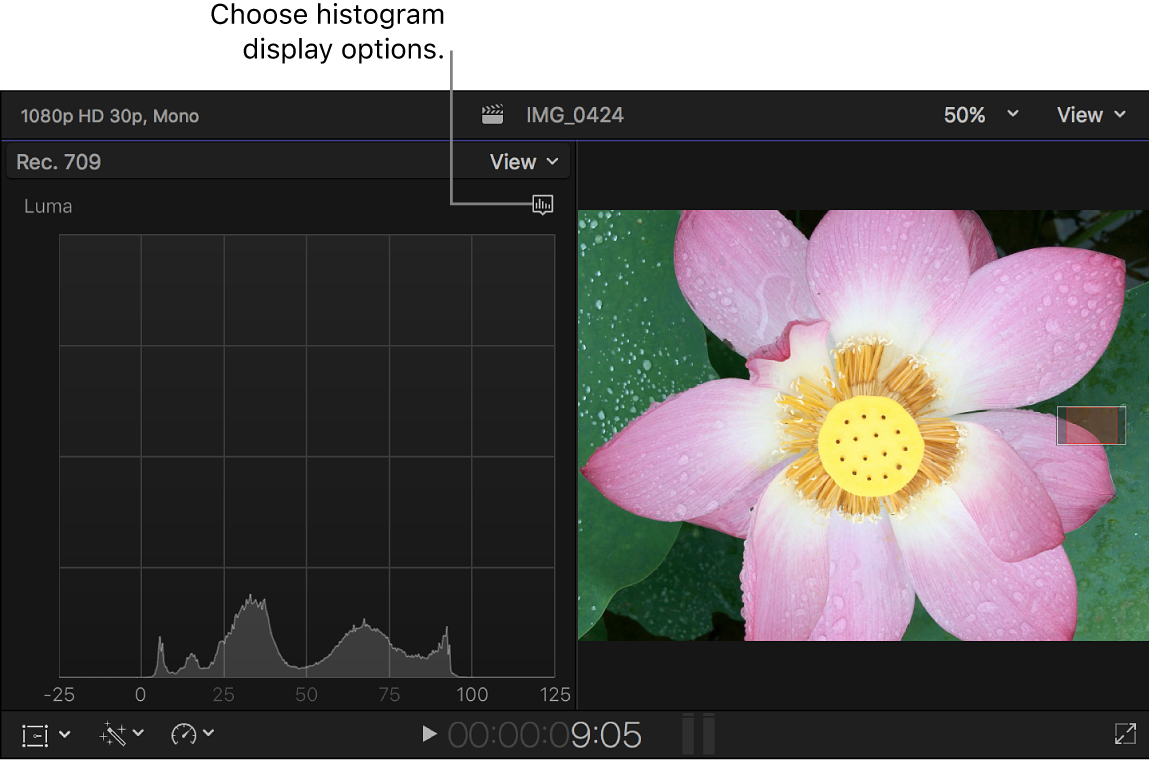
Luma: Shows only the luma component of the video. The height of the graph at each step on the scale represents the number of pixels in the image at that percentage of luma, relative to all the other values. For example, if an image has few highlights, the histogram shows a large cluster of values in the midtones.

Using the Luma histogram view, you can quickly compare the luma of two shots so that you can adjust their shadows, midtones, and highlights to match more closely.
The shape of the graph also helps you determine the amount of contrast in an image. A low-contrast image has a concentrated clump of values nearer to the center of the graph. By comparison, a high-contrast image has a wider distribution of values across the entire width of the graph.
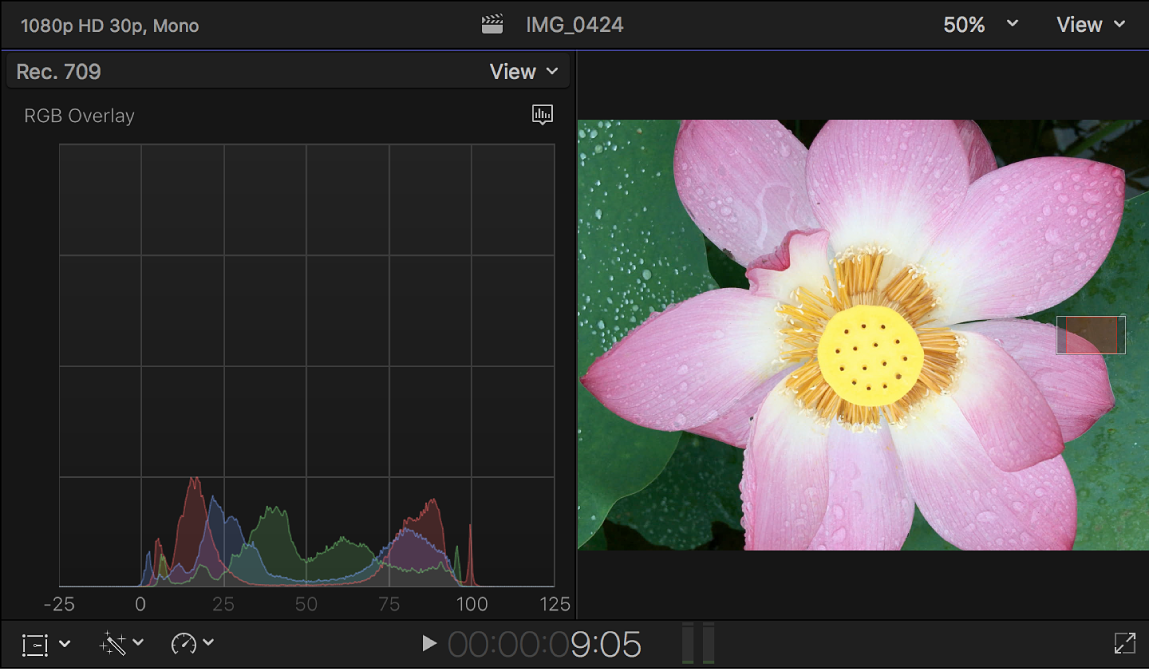
RGB Overlay: Combines waveforms for the red, green, and blue color components in one display. If the image being examined has equal levels of two or more colors, you see the combined color:
Equal levels of green and blue appear as cyan.
Equal levels of green and red appear as yellow.
Equal levels of red and blue appear as magenta.
Equal levels of red, green, and blue appear as gray.

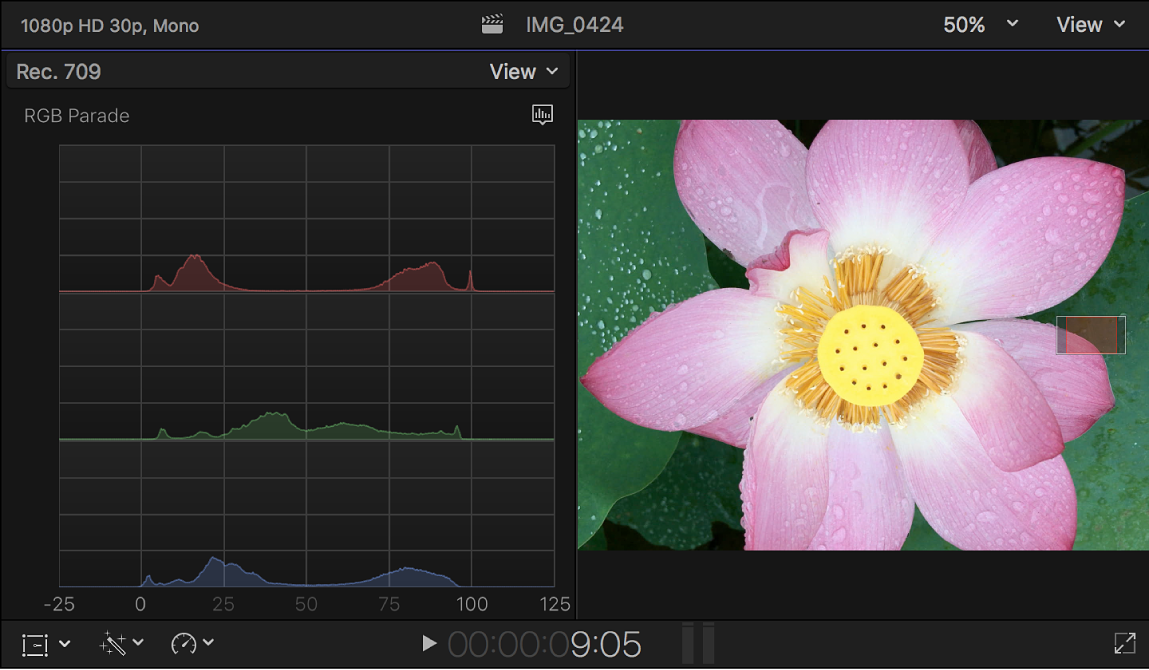
RGB Parade: Presents three graphs that display your video as separate red, green, and blue components. The waveforms are tinted red, green, and blue so that you can easily identify them.

You can use the RGB Parade view to compare the relative distribution of each color channel across the tonal range of the image. For example, images with a red color cast have either a significantly stronger red graph or weaker green and blue graphs.
Red: Shows only the red color channel.
Green: Shows only the green color channel.
Blue: Shows only the blue color channel.
Download this guide: PDF