Pages
Pages User Guide for Mac
- Welcome
- What’s new in Pages 13.2
-
- Use iCloud Drive with Pages
- Export to Word, PDF or another file format
- Open an iBooks Author book in Pages
- Reduce the document file size
- Save a large document as a package file
- Restore an earlier version of a document
- Move a document
- Delete a document
- Lock a document
- Password-protect a document
- Create and manage custom templates
- Copyright

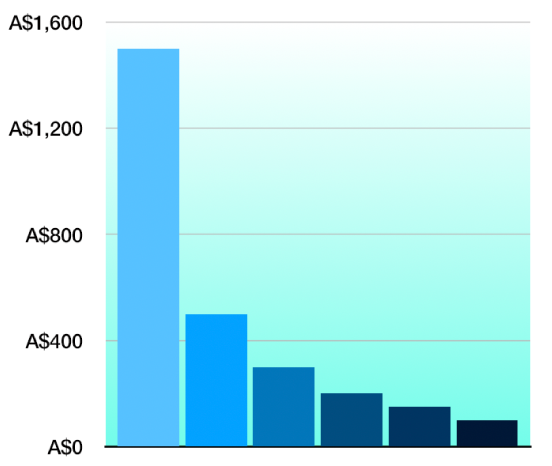
Add a border and background to a graph in Pages on Mac
You can add a border and a background colour to any 2D bar, column, area or scatter plot.
Click the chart, then in the Format
 sidebar, click the Chart tab.
In the Graph Options section of the sidebar, select the Border tick box.
To add a background colour to the graph, or to choose a style and colour for the border, click the disclosure arrow next to Background & Border Style, then use the controls in that section.
Thanks for your feedback.