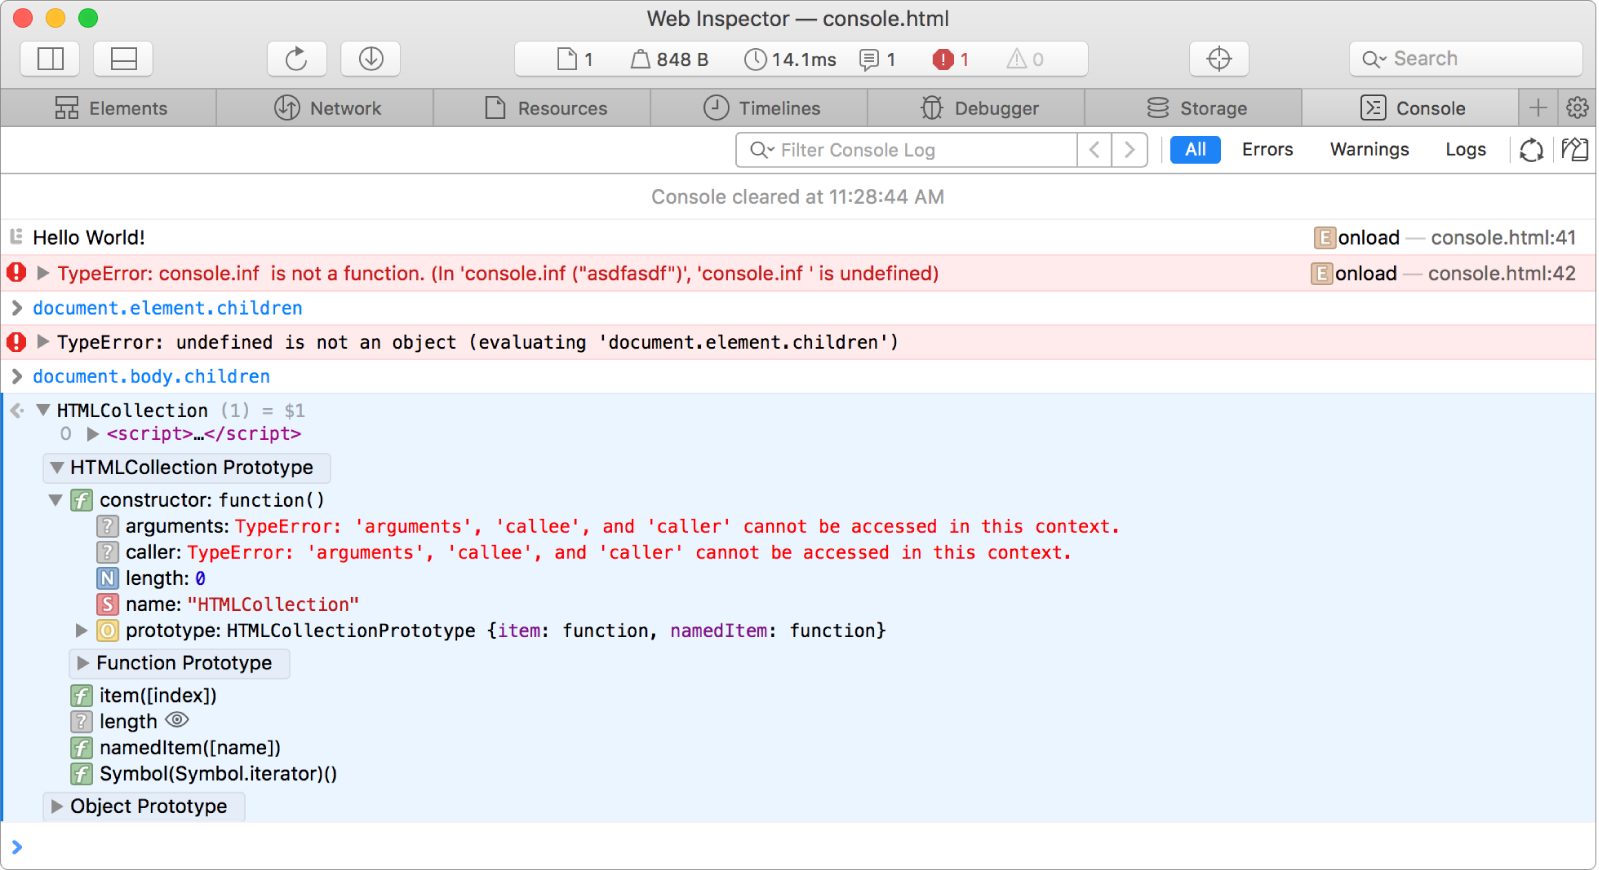
Log messages with the console
The console prompt (marked with ![]() ) is where you can enter and evaluate any JavaScript code.
) is where you can enter and evaluate any JavaScript code.
The console has three positions:
Console prompt (shown at the bottom of the content area in every tab)
Split Console (shown in the lower half of the tab and splits the window; not available in every tab)
Console Tab (takes up the entire main content area)
The Split Console automatically appears when you evaluate something in the console prompt. Clicking the double arrow in the console prompt’s filter bar will expand the console to full height and switch to the Console Tab.
While typing at the prompt (or many other places that accept JavaScript expressions), Web Inspector provides autocompletion suggestions. These are generated by evaluating the most recent partial expression in the current context.

Use autocompletion in the console
Do any of the following:
Change an autocompletion suggestion: Press the Up Arrow or Down Arrow key to move through the list of previous console evaluations.
Accept an autocompletion suggestion: Choose an item in the list, then press Return.
Dismiss an autocompletion list: Press Escape (Esc).
Insert a new line at the prompt
Press Shift-Return.
Evaluate the current expression at the prompt
Press Return. The evaluation will appear below the current expression.
Note: If the expression is not parseable and does not introduce new scopes, such as window, then pressing Return adds a new line; otherwise, the evaluation will produce an error.
When an expression is evaluated, the expression and its result is added into the list of console messages. The expression is marked with ![]() and the evaluation result is marked by
and the evaluation result is marked by ![]() if successful, or an error marker
if successful, or an error marker ![]() if an error was encountered.
if an error was encountered.
Successful evaluation results are bound to special $n variables that are only accessible from the console prompt. This special variable binding is appended to the evaluation result to remind you that the result can be referenced by name and used in further console evaluations.
When an evaluation result is a JavaScript object, Web Inspector shows a short preview of the result. For JavaScript objects, this preview includes the first few properties of the object. For arrays, the first few elements and the array length (in parentheses) is shown.
Console messages are color-coded according to their log level.
Console error messages are produced by WebKit internally (such as to report a blocked cross-origin access or a failed WebSocket connection) or by calls to
console.erroron the inspected web content.Console warning messages are produced by WebKit internally (such as when something cannot be parsed) or by calls to
console.warnin the inspected web content.All other messages produced by the inspected context via the Console API (
console.log,console.trace, and so on) are treated as Log level messages.
View the full contents of a JavaScript object in an object tree
Click the disclosure triangle next to the preview to reveal a tree view of the result. For objects, properties are shown with their own object previews and each property can be further expanded to show its entire value. Similarly, arrays and array-like native/DOM objects show previews of all elements when expanded.
The prototype of an object is shown at the bottom of an expanded object tree. The prototype itself is an object tree, allowing you to inspect properties and prototypes of prototypes for any logged object.
Some native objects such as Promises display additional fields when expanded that may not be accessible to JavaScript, such as whether a Promise is pending, resolved, or rejected.
Log a value from an object tree to the console
Control-click a value in an expanded object tree, then choose Log Value from the shortcut menu. This binds it to a special $n variable. Alternatively, copy an expression that evaluates to the variable (such as window.images[2].className).
Navigate to an evaluation’s source location in the Debugger tab
Click the source location next to an evaluation to reveal it in the Debugger Tab. Most console messages have an associated source location on the right side that's responsible for the message.
Expand an error message
Click the disclosure triangle next to the error message to see additional information such as a stack trace or objects relevant to the error.
Web Inspector console uses the Console API and the Command Line API.
Note: If you want logs to persist on navigation, uncheck the default setting "Clear when page navigates” in the settings.