Activity Monitor Help
Welcome to Activity Monitor
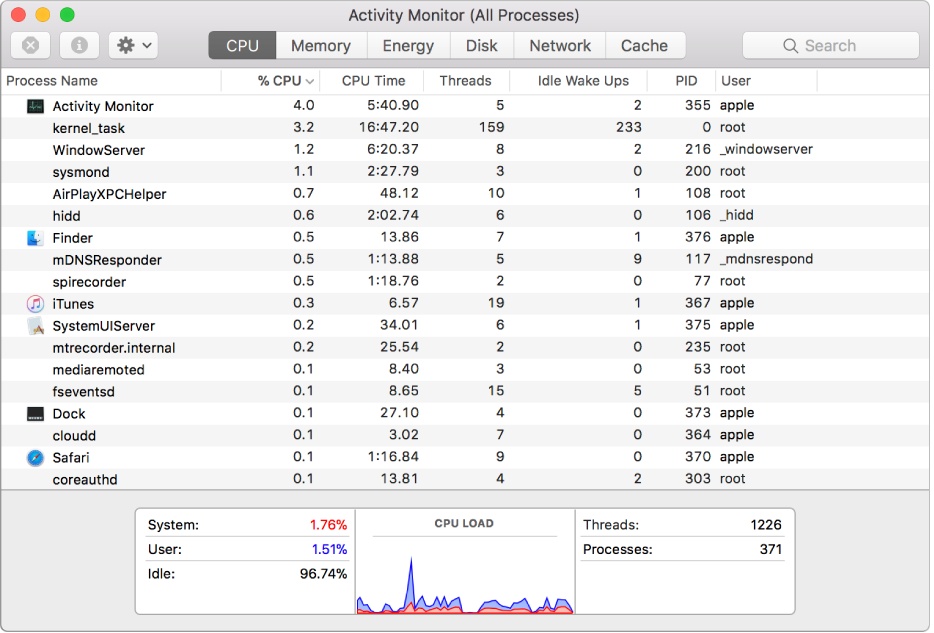
View information about how apps and other processes are using your system resources, including the processor, disks, memory, and network.


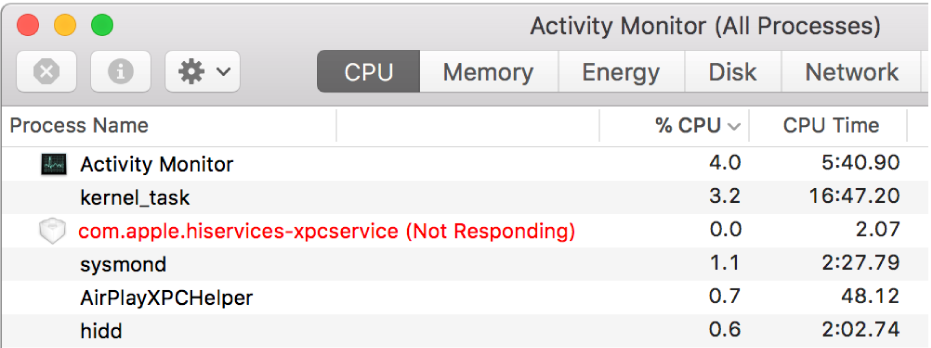
Close unresponsive apps and processes
When your system is acting sluggish or simply not responding, an app or process may be the source of the problem. You can use Activity Monitor to locate the troublesome app or process and force it to quit. Select the app or process, then click ![]() .
.

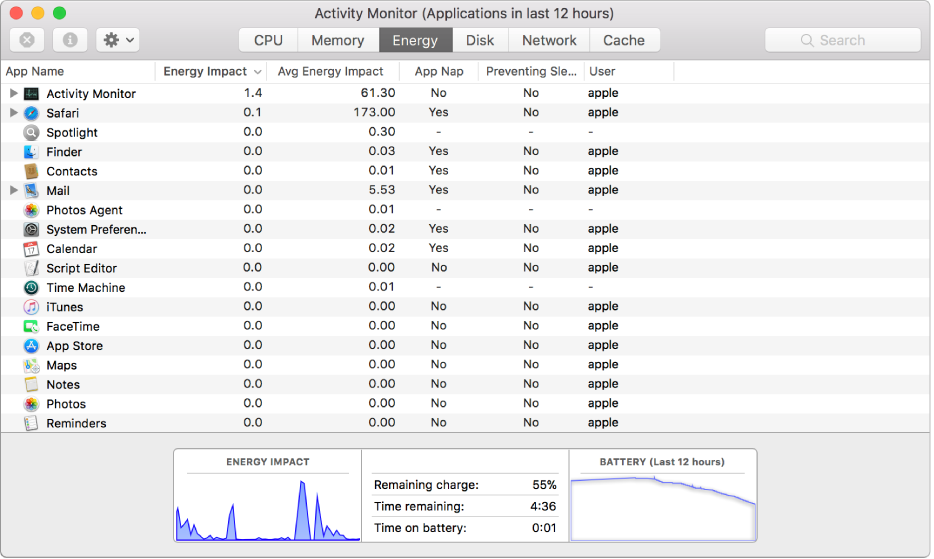
See how much energy your Mac is using
Do you want to know how much energy your Mac is using, or see which apps or processes are using the most energy? Just click Energy to view the energy impact of your apps.

See real-time CPU, network, or disk status in the Dock
It’s easy to keep an eye on your system status without even looking at the Activity Monitor window. Just choose View > Dock Icon, and you can monitor your current CPU, network, or disk usage as a live graph in the Dock.
Want to learn more? See View information about processes, Quit a process, and View energy consumption.