Add or edit categories in Numbers for iCloud
You can use categories to organize the data in your table. For example, if you have a spreadsheet that tracks shirt sales, you could create a category that groups sales by month.
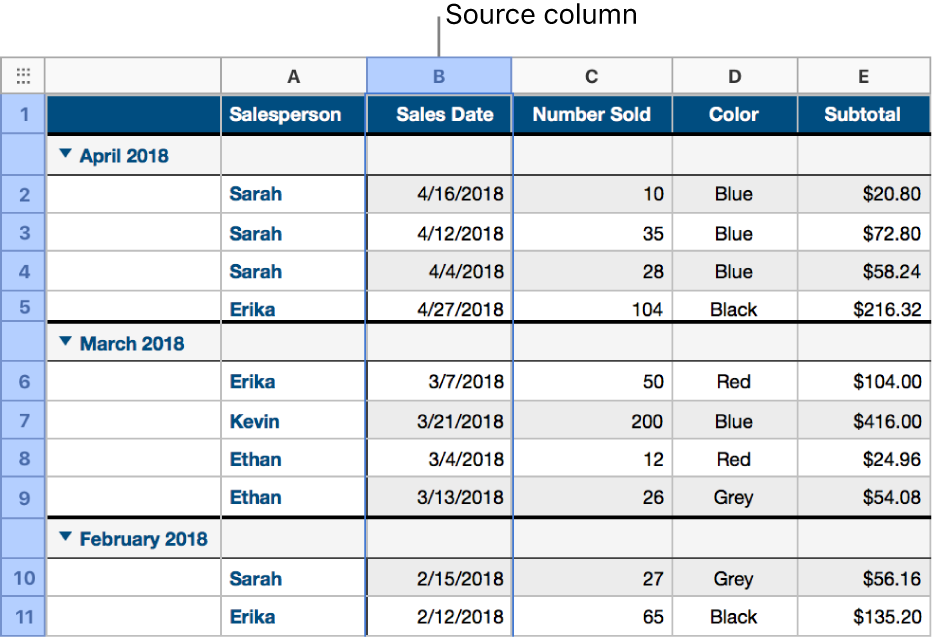
There are two ways to create a category: choose a source column of data that you want to group, or manually select rows that you want to group. Choosing a source column is best when your table already contains the data you want to group. Manually selecting rows works best when the data you want to group isn’t in the table. For example, in the table below, if you wanted to group data for full-time versus part-time salespeople (data that’s not currently tracked in the table), you could manually add the appropriate rows to each group.

A table can have one main category and up to four subcategories. You can change the hierarchy, rename or delete categories, and more.
Create a category using a source column
When you create a category by selecting a source column, Numbers for iCloud automatically organizes your data into groups that share common values in the source column.
Select the column you want to use to create the category.
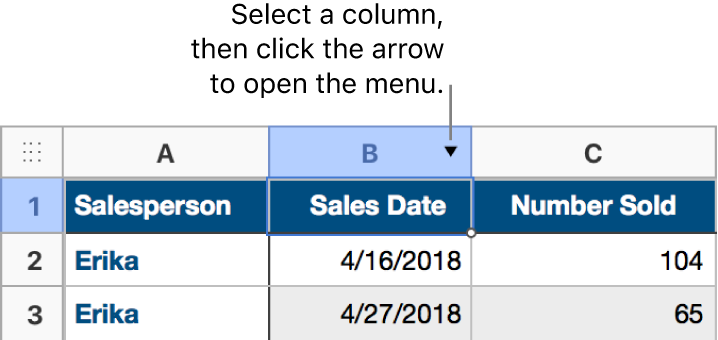
Move the pointer over the column letter, click the arrow that appears, then choose “Add Category for Column Name.”

The rows in the table are automatically organized into groups that share a common value in the source column.
To add a subcategory, select another column in the table, click the down arrow on its border, then choose “Add Category for Column Name.”
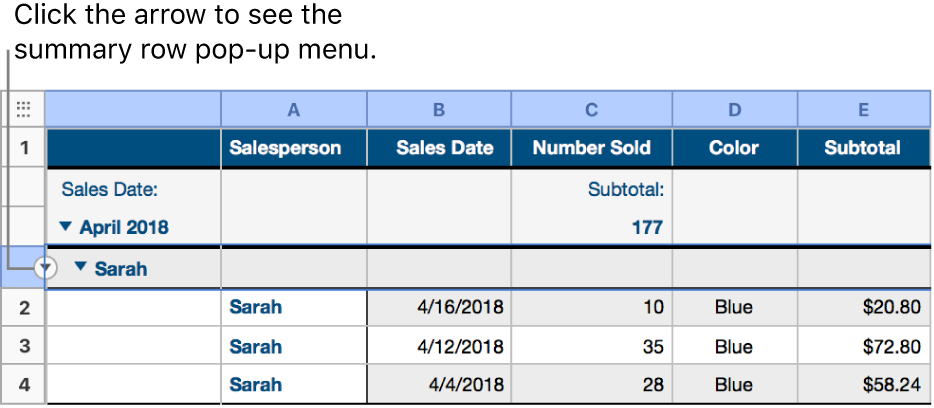
The table is reorganized to show the subcategory below the main category.
You can also create categories using controls in the sidebar. Click the Organize button
 in the toolbar, click Categories at the top of the sidebar, then click the Add a Category pop-up menu and choose a column.
You can enter text and numbers in a categorized table just as you do in a standard table. The table reorganizes automatically based on changes to the data.
Create a category from a selection of rows
If there is no source column of data for the category you want to add, you can manually create categories by selecting rows you want to group. For example, for a table that lists colleges you’re interested in, with columns for state, tuition, and distance, you might want to organize it by colleges you want to visit. You could simply select the row for each college you want to add to that group.
Select the rows you want to group together.
Move the pointer over a row number in your selection, click the arrow that appears, then choose Create Group for Selected Rows.
If there are no other categories in the table, a source column called Category 1 is added to the end of the table. The rows are organized into two groups, Group 1 and Group 2; one for the data you selected, and one for the data you didn’t select.
If the table is already categorized, the new group is given a placeholder name in the existing source column (instead of creating a new category).
Change the hierarchy of the categories
If your table contains subcategories, you can move a category up or down in the hierarchy to reorganize your data. For example, if you have a table that categorizes shirt sales by sales date and then by salesperson, you could reorganize to categorize by salesperson first and then by sales date.
Select the summary row (the one with the group name) for the group you want to move.
Move the pointer over the row border (to the left of the first column in the row), click the arrow that appears, then choose Promote to move the category up in the hierarchy, or Demote to move it down.

Hide or show a source column
You can hide a source column to reduce the amount of data shown in a categorized table. The table remains categorized by the data in the hidden column.
Select the table, click the Organize button
 in the toolbar, then click Categories at the top of the sidebar.
Click Hide Column below the category whose source column you want to hide; to show it again, click Unhide Column.
Rename a category
In the source column for the category, select the column header text, type a new name, then press Return.
Note: The category label that appears above the group name in the summary row can’t be edited.
Turn categories on or off
If you want to see your original table with uncategorized data, you can turn categories off. You can turn categories back on at any time, and your data is regrouped based on any edits you made while categories were turned off.
Select the table, click the Organize button
 in the toolbar, then click Categories at the top of the sidebar.
Deselect the Categories checkbox.
To view the categorized table again, select the Categories checkbox.
Delete a category
You can delete a category so the data is no longer organized into groups (the data itself remains in the table). When you delete a category that has subcategories, the subcategories move up in the hierarchy.
Select the table, click the Organize button
 in the toolbar, then click Categories at the top of the sidebar.
Click the Trash icon
 to the right of the category you want to delete.