Intro to categories in Numbers for iCloud
You can organize the data in a table into categories to view the information in totally new ways. For example, if you use a spreadsheet to track your company’s shirt sales, you could create a category that groups sales by month to easily see changes over time. You can create categories by selecting particular rows of data that you want to group together, or Numbers for iCloud can organize your data automatically using values in one or more columns (called source columns) that you select.
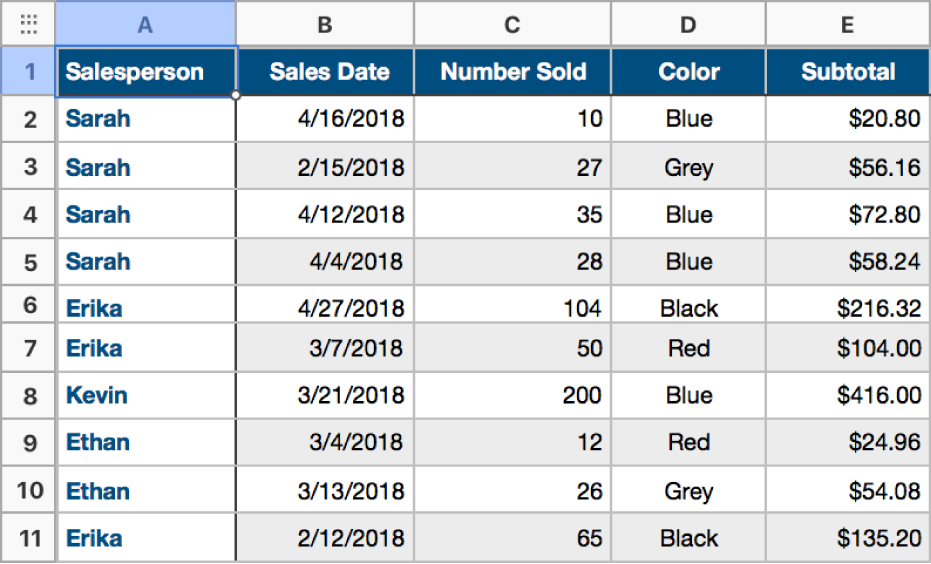
The following example shows an uncategorized table containing shirt sales data.

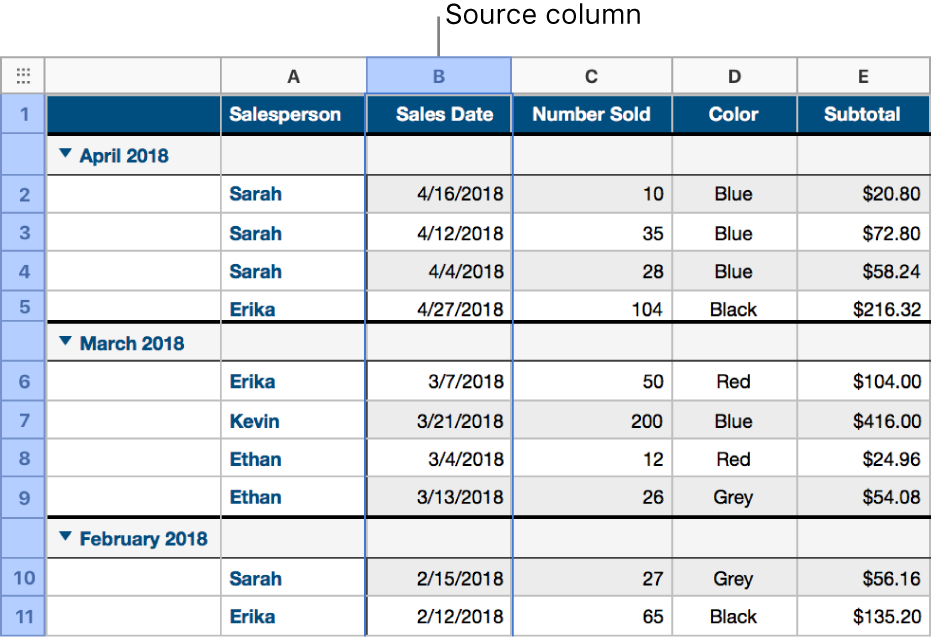
The table below shows the same data categorized by the sales date. All rows that share a common value in the source column—in this case, the sales month—are now grouped together.

A table can have one main category and up to four subcategories to create a hierarchy for your data. For example, you could further categorize the monthly sales shown above by salesperson, number of shirts sold, and so on.
You can also easily summarize the information in a categorized table using the summary row—a special row above each group (where the group name appears). When you click a cell in a summary row, you can add built-in functions like subtotal, count, or average.
You can rename the groups or categories, turn categories off or on, and more.
Note: In Numbers on Mac, Numbers on iPhone, or Numbers on iPad, you can also create and use pivot tables to analyze sets of data and identify interesting patterns or trends. For more information, see Numbers Help on Mac, Numbers Help on iPhone, or Numbers Help on iPad.